These findings are shared for research purposes and indications for decision makers to help them broaden perspectives and expand understanding until they materialize in a reviewed paper.
Lockdown policies
Studying
data from Project for European Mortality Monitoring in Denmark it
appears if we assume that overmortality peak was caused by Covid
and not lockdown that some countries were caught of guard by a
virus that is mild enough to be invisible with a changing R value,
a fairly long incumbation period,
accelerating suddenly and taking its course.
In
such countries Spain, Italy, France, Belgium, UK, Netherlands,
Switzerland, Sweden and possibly Portugal, Malta and Greece had
peaked before any
people’s lockdown took place.
We
classified lockdowns into 7 major groups
1-
Stop large gatherings, encourage social distancing --→ Sweden
2-
Places lockdown =Shut closed places of gatherings, separate
regions and strongly encourage working from home (restaurants,
-----→ Switzerland, Germany, Denmark, Finland, Malta,
Greece, Austria, Ireland, Netherlands, Australia, New Zealand)
3-
Peoples’ lockdown = Places lockdown + Shut down parks + Restrict
peoples’ movements within the city to absolute necessity under
police control –-→ Italy, Spain, France, Belgium, UK
4-
Night lockdown = Mild places lockdown + Allow movements in
daytime, restrict them at night (Senegal, Algeria, Egypt….)
5-
Full contact tracing = South Korea, Taiwan, Singapore
6-
3Cs lockdown = Instruct population to avoid Closed spaces, Crowded
places, close Contact settings –→ Japan)
7-
Different policies across a same country Mostly large Federal
countries –→ USA, Brazil,China...
Understanding
how much of its natural course the virus had, gives insight as to
how much collective immunity was acquired in a particular context.
To understand such course a few sample countries were analyzed
working backwards from mortality peak to probable infection date.
Given
that the median delay between infection and death lies between 21
days and 25 days (5.1 days incumbation to symptoms and 17.8 days
symptoms to death). That places infection peak
week 11 that is March 9 to March 15th before lockdown of
people happenned and after lockdown of cluster risk places had
taken place. Locking down non essential clustering places may have
been sufficient to reverse the curve that started becoming
agressive around week
8 to 9. For at least 12 weeks the epidemic was moving at a very
slow pace becoming very aggressive when conditions are united.
https://www.acpjournals.org/doi/10.7326/M20-0504
« The median incubation period was estimated to be
5.1 days (95% CI, 4.5 to 5.8 days) »
https://www.ncbi.nlm.nih.gov/pmc/articles/PMC7014672/
« we
estimate the mean incubation period to be 6.4 days (95% credible
interval: 5.6–7.7) »
https://www.thelancet.com/journals/laninf/article/PIIS1473-3099(20)30243-7/fulltext
« we
estimated
the mean duration from onset of symptoms to death to be 17·8 days
(95% credible interval [CrI] 16·9–19·2) »
Above
studies are further confirmed by the fact that using google’s
mobility data we found as mentionned above for countries with high
death count that correlation between daily ridership and death
count was highest at 25 days lag.
We
checked EuroMomo’s data and dates by comparing their curves with
data extracted from INSEE in France and Statbel in Belgium to find
them consistent with EuroMoMo’s data.
We
traced back with a fairly reasonable degree of confidence
infection peak time
for countries by placing it 3 weeks before overmortality peak to
evaluate how much of its natural course the disease had in
different countries.
<
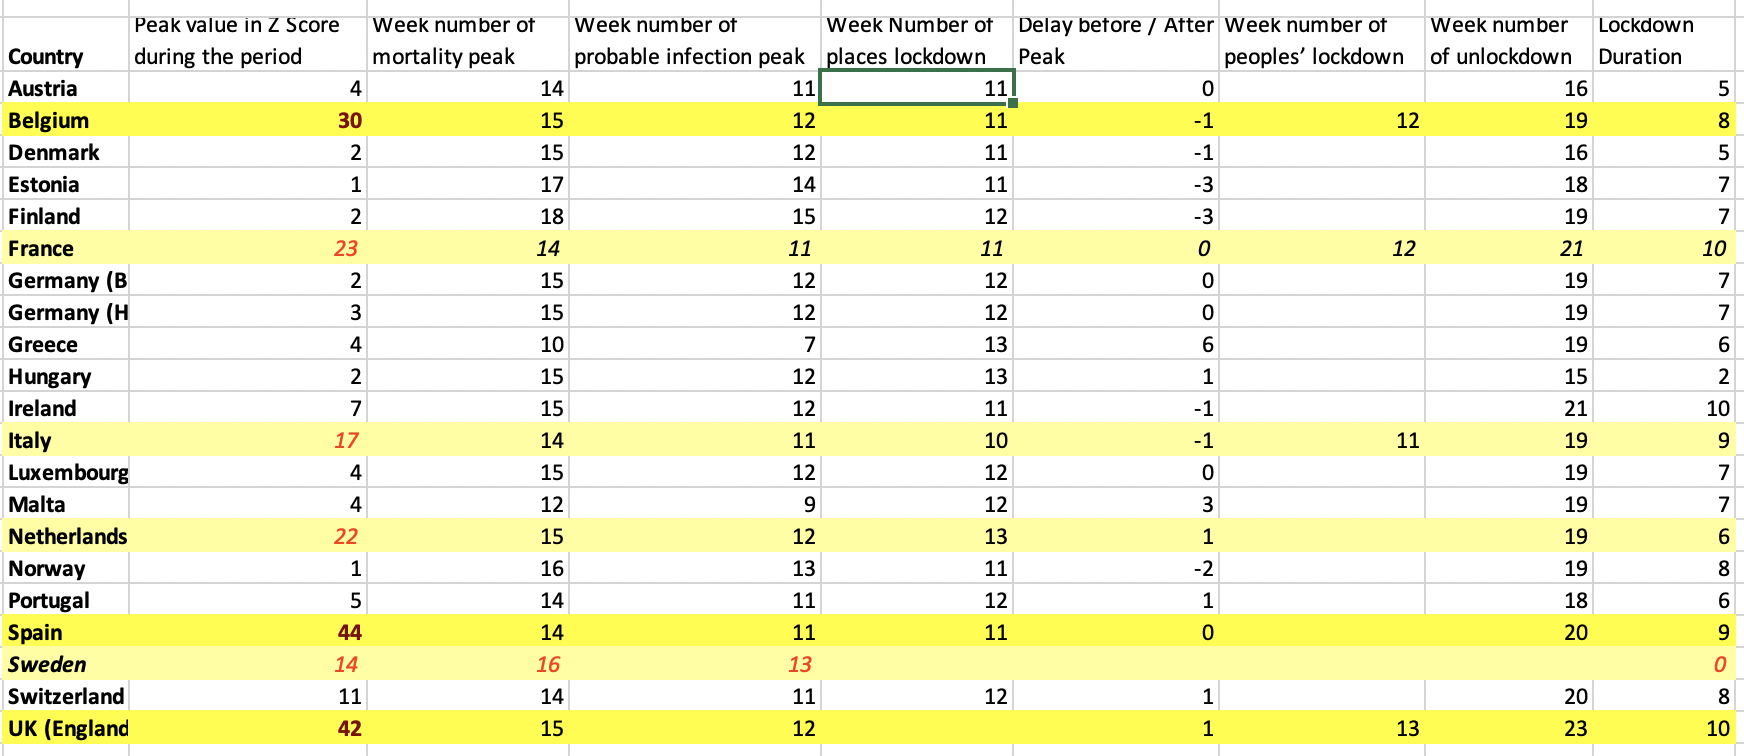
Most
peoples’ lockdown happenned concurrently or after peak had
happenned and curve had turned around.
Belgium
had hit a plateau of 83 deaths on April 4th with consecutively 70,
75 and 86 to start a drop as off April 8th, placing probable peak
and turnaround infection period around March 16th. That places
turnaround right after places lockdown and before peoples’
lockdown.
France
hit its plateau of overmortality April 1st which places probable
peak and turnaround around March 12th and March 14th after large
gatherings ban, right before places lockdown and and 4 days before
peoples’ lockdown. This seems to apply to Belgium, France, Italy
and UK.
Places
lockdown intervened in some cases before places lockdown, in some
cases after and in some cases concurrently with no clear trend as
to outcome in terms of mortality.
Countries
recurring to peoples’ lockdown did so as they were heading towards
a high price to pay and at the time of the decision had no
knowledge as to where they were in the curve except for epidemic
models, most of which turned out to be faulty. They could have
started to understand around April 10th seeing consecutive days in
mortality drops and relying on available studies from far east as
to what measures may have contibutes to such turnaround in the
curve.
Also
there is no clear tendency, as to lockdown duration and severity.
Most
countries that locked down early have avoided a severe peak, but
again Greece, Protugal, Malta and Switzerland locked down late and
had a mild epidemic.
From
above data, it seems reasonable to assume that epidemic followed
much of its natural course in at least 17 of 21 countries
mentionned.
This
is further confirmed by the absence of rebounds anywhere except
for localized clusters in locations/populations that had not been
exposed.
This
calls for attention as some regions may see their population
density and composition change.
Otherwise
regions that were exposed and where epidemic took its course
benefit of a fair level protection under spring summer conditions
with some risk of occasional clusters but limited risk of a full
national epidemic.
Looking
at a different part of the world, Japan has had no lockdown, has
performed relatively few tests (less that most European
countries), has very dense cities and one of the oldest world
populations, yet it has suffered a very mild epidemic that did not
seem to rebound. Japan simply instructed its population very early
on to avoid Closed places, large Crowded places, and unecessary
physical Contacts with strangers as a policy that could be applied
on the long run. Could it have been sufficient ? Maybe their
diet and excellent
heatlh helped.
Tadjikistan
has had no lockdown and 6 deaths per million compared to Kazakstan
20 deaths per million.
Japan
fairs with 8 deaths per million people, UK 650, Spain 607, Italy
567, USA 399, Germany 52, Norway 46.