Germany Story Model
This Page shows how according to this model the Germany story would be described.
It is only an attempt to describe subject to corrections, improvements, suggestions.
Many models may provide different conclusions, this one shows some consistency and is the reason why we are sharing for better research for all.
You can see our analysis on the data and cross check to see how accurate the analysis is. You can see the dates, as per our analysis, at which the curve changes and things start becoming better by clicking here.
| This country has a population of 67 Millions | |||||||||||||||||||||||||||||||||||||
| This model describes best if situation started January 21st 2020 | |||||||||||||||||||||||||||||||||||||
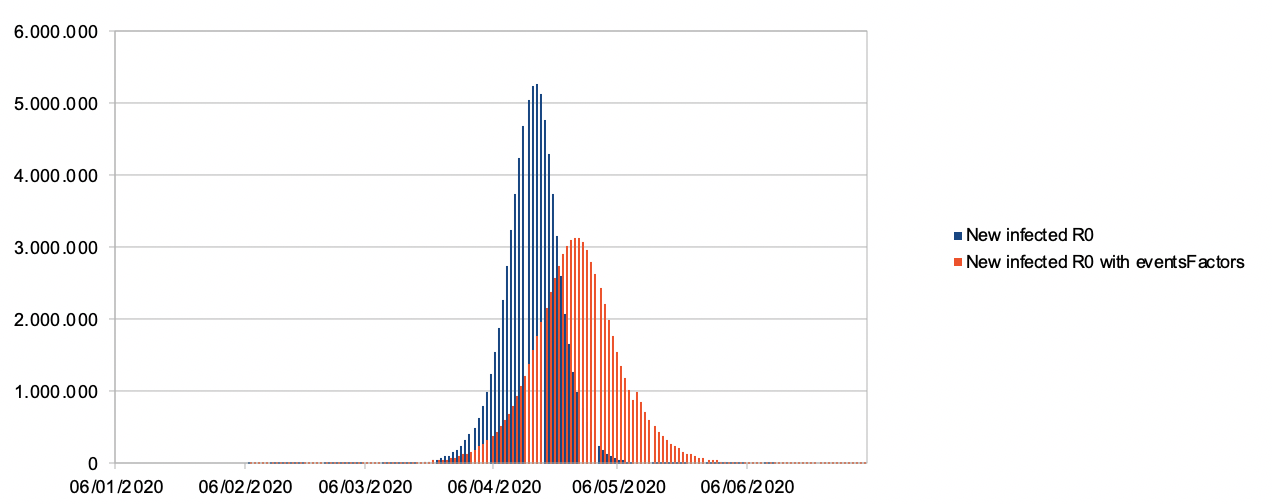
| Each individual was infecting at a rate of 0.3 per day during 9 to 10 days | |||||||||||||||||||||||||||||||||||||
| Government proceeded to progressive lockdowns March 17th | |||||||||||||||||||||||||||||||||||||
| https://www.theguardian.com/world/2020/feb/28/coronavirus-may-have-been-in-italy-for-weeks-before-it-was-detected |
(2,7 to 3,0) Fits best ran models – except for South Korea that seems to capture clusters regulary |
||||||||||||||||||||||||||||||||||||
| (2,7 to 3,0) Fits best ran models – except for South Korea that seems to capture clusters regulary | Model may work if its started a few days later but entered 2 infected people navigating in different spheres or a superspreader appeared early on | ||||||||||||||||||||||||||||||||||||
| On March 17th 2%? (Infected people) | |||||||||||||||||||||||||||||||||||||
|
|||||||||||||||||||||||||||||||||||||
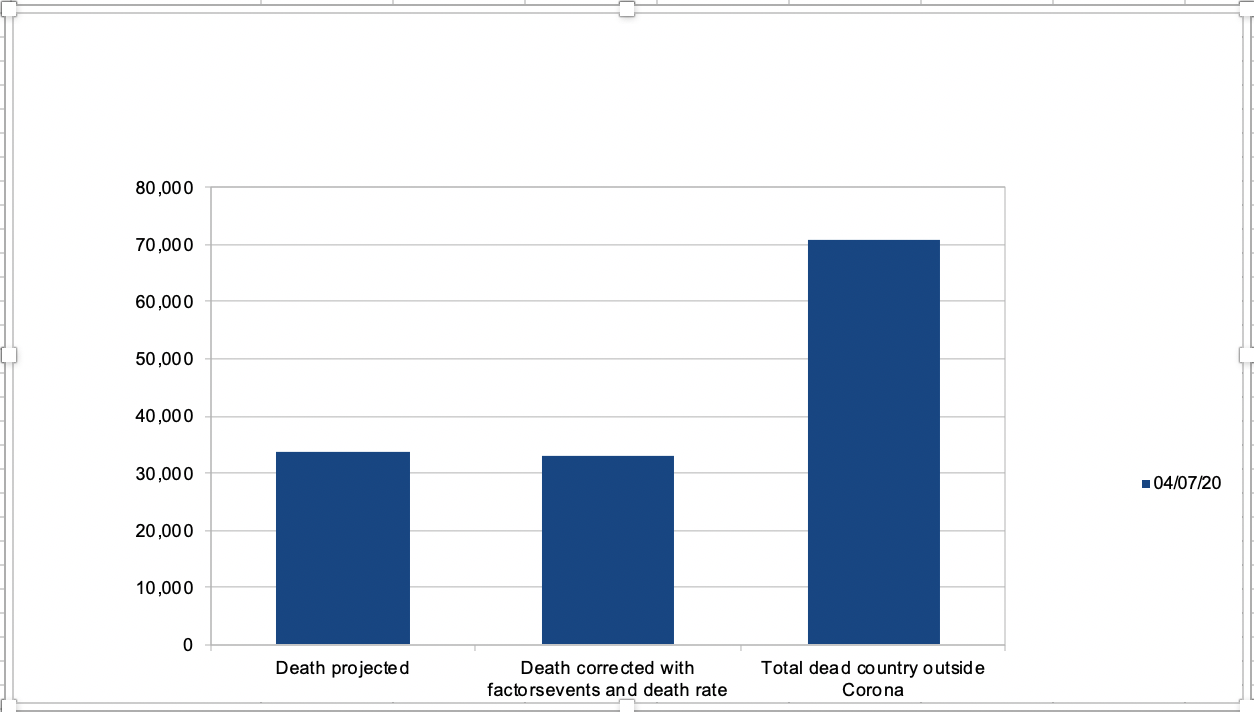
In all cases, these numbers are death with virus and not Over Mortality caused by Corona in a valid statiscal model
Such model would require
1) Available reliable data
2) Having details of human loss by category and after the fact calculating statistically what is the real over-mortality (this is how it is done with influenza in many countries)
Remember these are numbers that reflect losses with Corona as overmortality due to Corona can be calculated after the epidemic ends having all data (which cannot happen given the overwhelming circumstances and that not all can be tested)
We know the overmortality due to virus is lower, possibly significantly lower, than that of dead with virus, and communicated numbers will end up being a guess influenced by communication needs
An interesting figure would be changes in death rate in in January, February, March, April as they become available Such statistic would result in a lower number as unfortunately some people die with or without Corona
They would reflect impact of epidemic situation, the disease itself, anxiety, lockdown, trafic reduction…….
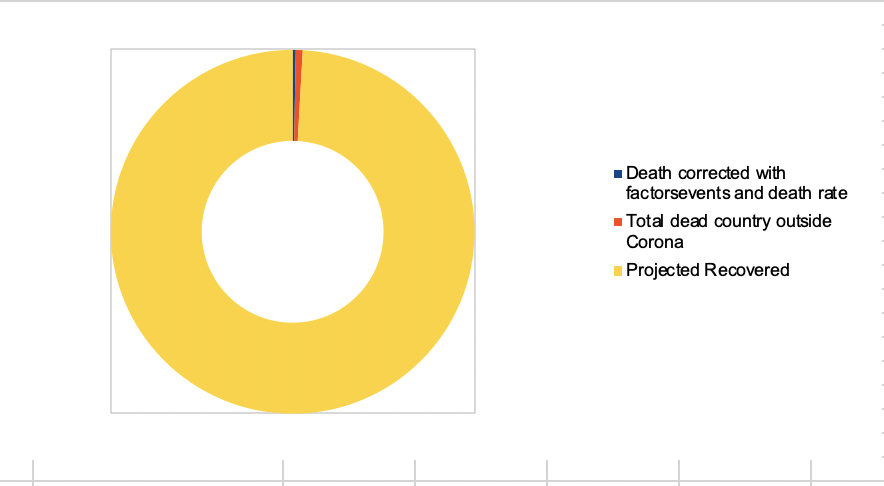
Most should recover in all cases and may develop some form of immunity
Life finds a way and most will recover and let’s remember all those who may have left us
Unfortunately sometimes life ends, we all try our best to have long nice best moments.
Some go with Corona (Maybe it shortenned their life, maybe not)
Some just go every day Let’s honor them all Let’s take care of a larger picture (obsessions restrict our thoughts)
A thought for healthcared professionals who have left because they were overworked
A thought for the elder who have left us with or without Corona without being able to say goodbye because of confinement
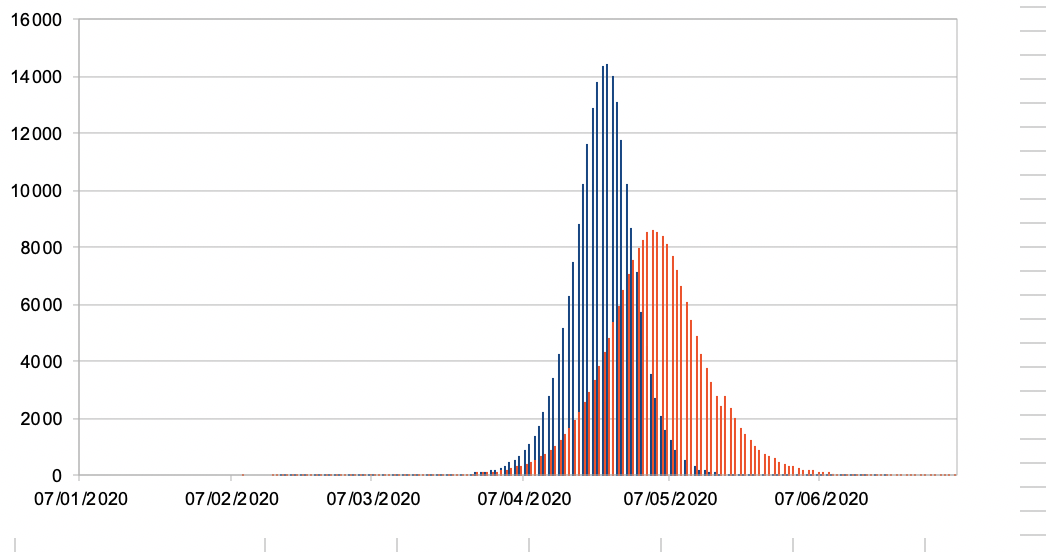
Infected in blue recovered in red
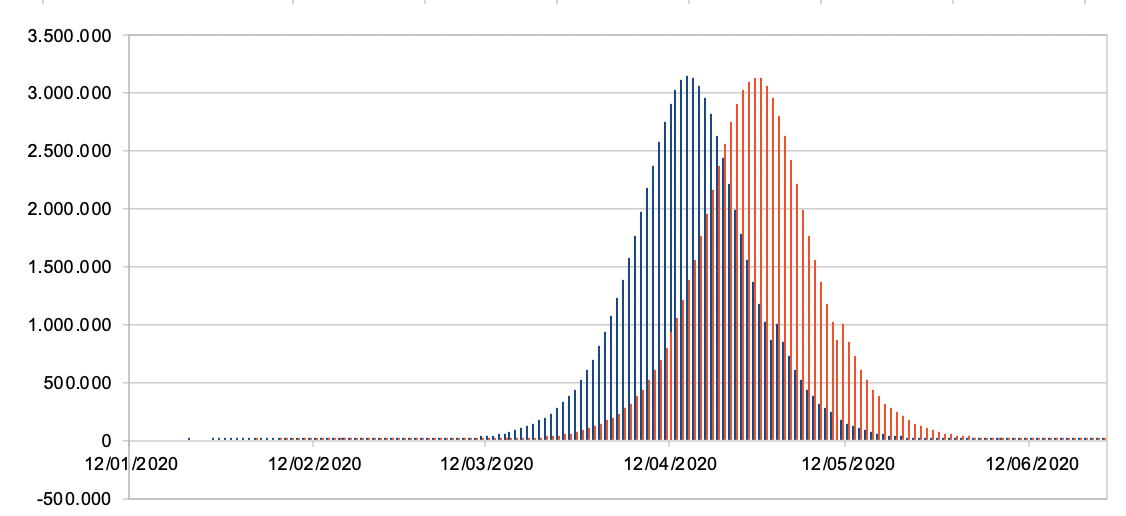
Infections and recoveries
All are stronger and a little more adapted
Much of the Population has immunity
Time to reconstruct
How does the model test against reality
Hypothesis confinement peak minimized if until April 12th. At this stage 2/3 of population would have been infected
Our analysis and its corelation to real available data is underneath:
| Date | Real Losses | Modeled Losses |
|---|---|---|
| 20/03/20 | 58 | 54 |
| 21/03/20 | 76 | 69 |
| 22/03/20 | 106 | 87 |
| 23/03/20 | 136 | 111 |
| 24/03/20 | 179 | 142 |
| 25/03/20 | 213 | 180 |
| 26/03/20 | 276 | 230 |
| 27/03/20 | 356 | 292 |
| 28/03/20 | 434 | 372 |
Infections and recoveries
All are stronger and a little more adapted
Much of the Population has immunity
Time to reconstruct
How does the model test against reality?