Possible factors for the severity of epidemic
We will produce a new set of models taking in account these factors as well as professor Bricaire's contributions
The conclusion would be the return of sanatoriums. (After all,
we used these techniques in the middle ages)
- In cities studied below, first quartile, curve rising up
happens as days are short, 4th quartile the curve dropping as
days become longer
- It doesn't like light (bats are nocturnal, Moscow should start dropping within 3 to 4 weeks)
- It slows as days become longer (question: it struck hardest end of winter when vitamin D levels were lowest ?)
- It doesn't like the cold (it starts late in Scandinavia, New York, Moscow)
-
It doesn't like sea shore (Madrid vs Barcelona, Milan vs Rome, Paris vs Marseille, Brussels vs Lille)
- It doesn't like heat (it has flat curves)
- It seems to be more virulent in late winter early spring (sun deficit?)
- It likes people grouped together with recycled ventilation (cave bat)
% of losses in the population to assess the severity of the epidemic by urban area
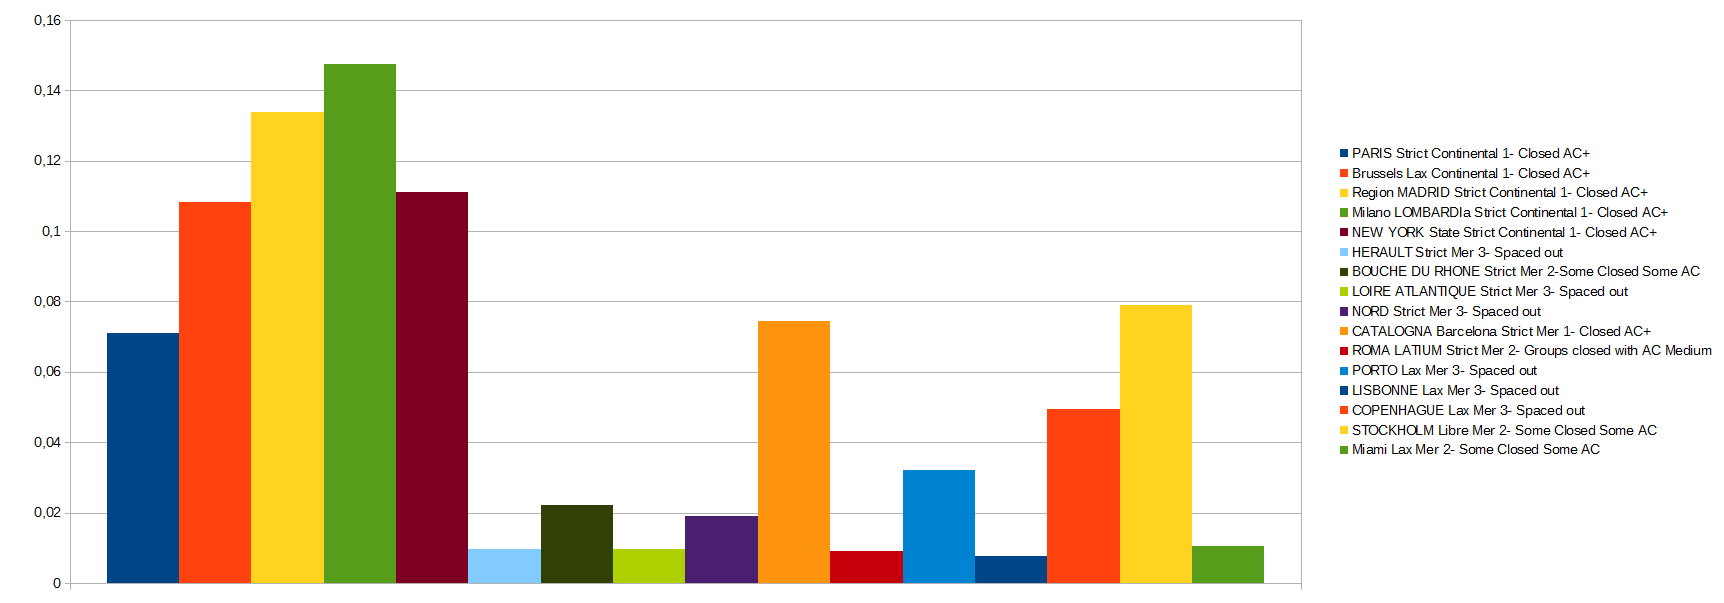
% of losses of population according to confinement (Italy, France, Spain), distance (Australia, Denmark), Free Sweden
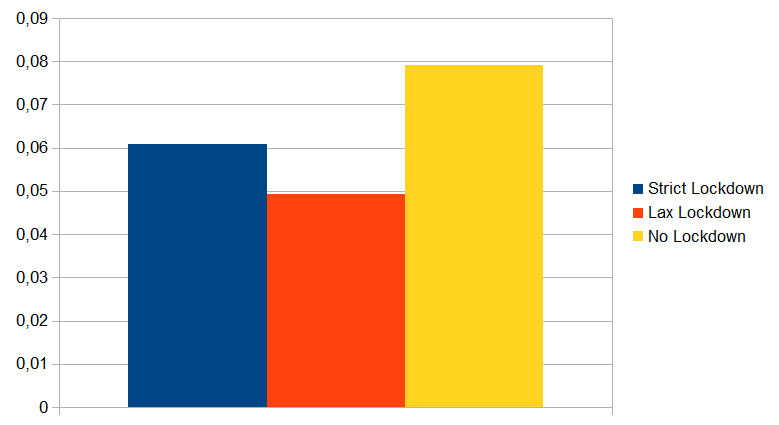
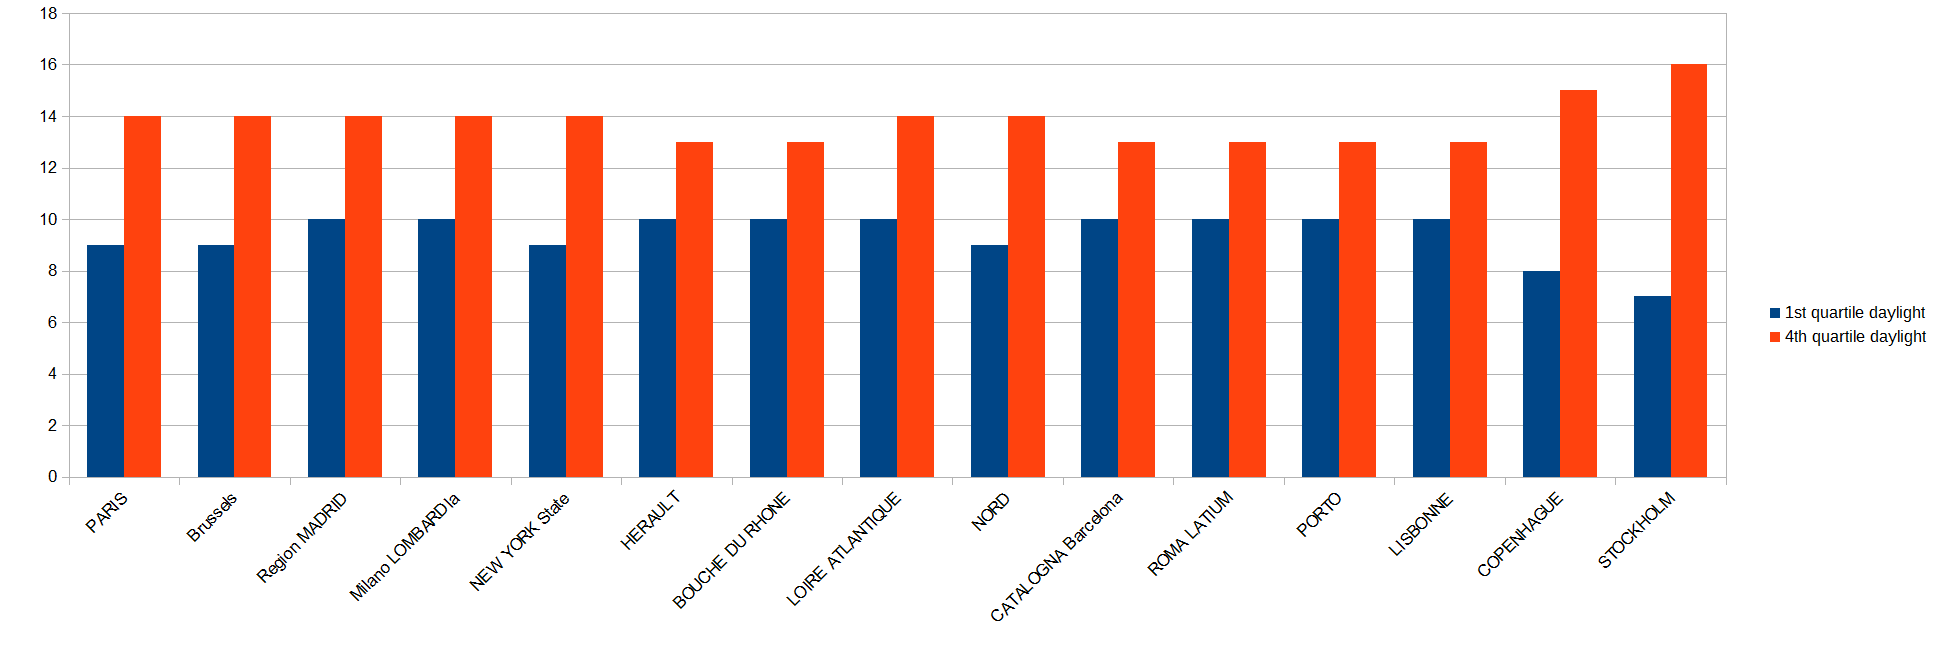
Table below shows our modeling of some European countries
These numbers reflect infection they are 1 to 2 weeks ahead of psychological effect, antibodies or symptoms appear 1 to 2 weeks after
| Country | 16/03/20 | 23/03/20 | 30/03/20 | 06/04/20 | 13/04/20 | 20/04/20 | 27/04/20 | 04/05/20 | 11/05/20 | 18/05/20 | 25/05/20 | 01/06/20 | 08/06/20 | 15/06/20 | 22/06/20 | |
|---|---|---|---|---|---|---|---|---|---|---|---|---|---|---|---|---|
| Italy | % of population exposed high | 6% | 14% | 30% | 37% | 45% | 50% | 53% | 55% | 58% | 65% | 69% | 70% | |||
| % of population exposed (heat effect) | 4% | 10% | 21% | 27% | 31% | 33% | 35% | 38% | 42% | 42% | 42% | 42% | ||||
| % of population exposed Serology tests | ||||||||||||||||
| %Losses Crude adjusted DR High | 0,32% | 0,32% | 0,32% | 0,32% | 0,32% | 0,32% | 0,32% | 0,25% | 0,25% | 0,25% | 0,25% | 0,25% | 0,25% | 0,25% | 0,25% | |
| %Losses Crude adjusted DR LOW | 0,09% | 0,09% | 0,09% | 0,09% | 0,09% | 0,09% | 0,09% | 0,07% | 0,07% | 0,07% | 0,07% | 0,07% | 0,07% | 0,07% | 0,07% | |
| % Losses as per serology test confirmed | ||||||||||||||||
| % Accuracy of model | High | High | High | OK | ||||||||||||
| 16/03/20 | 23/03/20 | 30/03/20 | 06/04/20 | 13/04/20 | 20/04/20 | 27/04/20 | 04/05/20 | 11/05/20 | 18/05/20 | 25/05/20 | 01/06/20 | 08/06/20 | 15/06/20 | 22/06/20 | ||
| Spain | % of population exposed high | 5% | 15% | 29% | 38% | 46% | 48% | 52% | 56% | 58% | 65% | 70% | 72% | |||
| % of population exposed low (heat effect) | 3% | 8% | 26% | 30% | 33% | 40% | 42% | 44% | 45% | 45% | 45% | 45% | ||||
| % of population exposed Serology tests | ||||||||||||||||
| %Losses Crude adjusted DR High | 0,28% | 0,28% | 0,28% | 0,28% | 0,21% | 0,21% | 0,21% | 0,21% | 0,21% | 0,21% | 0,21% | 0,21% | 0,21% | 0,21% | 0,21% | |
| %Losses Crude adjusted DR LOW | 0,09% | 0,09% | 0,09% | 0,09% | 0,09% | 0,09% | 0,09% | 0,07% | 0,07% | 0,07% | 0,07% | 0,07% | 0,07% | 0,07% | 0,07% | |
| % Losses as per serology test confirmed | ||||||||||||||||
| % Accuracy of model | High | High | High | OK | ||||||||||||
| 16/03/20 | 23/03/20 | 30/03/20 | 06/04/20 | 13/04/20 | 20/04/20 | 27/04/20 | 04/05/20 | 11/05/20 | 18/05/20 | 25/05/20 | 01/06/20 | 08/06/20 | 15/06/20 | 22/06/20 | ||
| France | % of population exposed high | 1% | 4% | 12% | 23% | 32% | 33% | 37% | 40% | 45% | 50% | 55% | 58% | |||
| % of population exposed (heat effect) | 1% | 3% | 7% | 14% | 20% | 25% | 27% | 29% | 31% | 33% | 35% | 35% | ||||
| % of population exposed Serology tests | 13,00% | |||||||||||||||
| %Losses Crude adjusted DR High (Cold) | 0,28% | 0,28% | 0,28% | 0,28% | 0,25% | 0,25% | 0,22% | 0,21% | 0,21% | 0,21% | 0,21% | 0,21% | 0,21% | 0,21% | 0,21% | |
| %Losses Crude adjusted DR LOW (Warm) | 0,08% | 0,08% | 0,08% | 0,08% | 0,07% | 0,08% | 0,08% | 0,07% | 0,07% | 0,07% | 0,07% | 0,07% | 0,07% | 0,07% | 0,07% | |
| % Losses as per serology test confirmed | 0,20% | |||||||||||||||
| % Accuracy of model (losses, rate, serology) | High | High | High | High | Heat/Cold | |||||||||||
| 16/03/20 | 23/03/20 | 30/03/20 | 06/04/20 | 13/04/20 | 20/04/20 | 27/04/20 | 04/05/20 | 11/05/20 | 18/05/20 | 25/05/20 | 01/06/20 | 08/06/20 | 15/06/20 | 22/06/20 | ||
| Netherlands | % of population exposed high | 0% | 1% | 2% | 5% | 10% | 18% | 25% | 35% | 40% | 45% | 50% | 55% | |||
| % of population exposed low (heat effect) | 0% | 1% | 2% | 3% | 5% | 7% | 9% | 29% | 31% | 33% | 35% | 35% | ||||
| % of population exposed Serology tests | ||||||||||||||||
| %Losses Crude adjusted DR High | 0,22% | 0,25% | 0,25% | 0,25% | 0,25% | 0,25% | 0,25% | 0,25% | 0,22% | 0,21% | 0,21% | 0,21% | 0,21% | 0,21% | 0,21% | |
| %Losses Crude adjusted DR LOW | 0,08% | 0,08% | 0,08% | 0,08% | 0,07% | 0,08% | 0,08% | 0,07% | 0,07% | 0,07% | 0,07% | 0,07% | 0,07% | 0,07% | 0,07% | |
| % Losses as per serology test confirmed | ||||||||||||||||
| % Accuracy of model | High | High | High | High | ||||||||||||
| 16/03/20 | 23/03/20 | 30/03/20 | 06/04/20 | 13/04/20 | 20/04/20 | 27/04/20 | 04/05/20 | 11/05/20 | 18/05/20 | 25/05/20 | 01/06/20 | 08/06/20 | 15/06/20 | 22/06/20 | ||
| Denmark | % of population exposed high | 0% | 1% | 3% | 7% | 12% | 20% | 30% | 38% | 40% | 45% | |||||
| % of population exposed (heat effect) | 0% | 1% | 2% | 4% | 7% | 12% | 15% | 20% | 22% | 25% | ||||||
| % of population exposed Serology tests | 2,70% | |||||||||||||||
| %Losses Crude adjusted DR High | 0,22% | 0,25% | 0,25% | 0,25% | 0,25% | 0,25% | 0,25% | 0,25% | 0,25% | 0,25% | 0,21% | 0,21% | 0,21% | 0,21% | 0,21% | |
| %Losses Crude adjusted DR LOW | 0,08% | 0,08% | 0,08% | 0,08% | 0,07% | 0,08% | 0,08% | 0,07% | 0,07% | 0,07% | 0,07% | 0,07% | 0,07% | 0,07% | 0,07% | |
| % Losses as per serology test confirmed | 0,16% | |||||||||||||||
| % Accuracy of model | High | High | High | High | ||||||||||||
| 16/03/20 | 23/03/20 | 30/03/20 | 06/04/20 | 13/04/20 | 20/04/20 | 27/04/20 | 04/05/20 | 11/05/20 | 18/05/20 | 25/05/20 | 01/06/20 | 08/06/20 | 15/06/20 | 22/06/20 | ||
| Germany | % of population exposed high | 0% | 0% | 2% | 5% | 15% | 27% | 30% | 35% | 40% | 45% | 50% | 50% | |||
| % of population exposed low (heat effect) | 0% | 0% | 1% | 3% | 9% | 20% | 25% | 29% | 31% | 33% | 35% | 35% | ||||
| % of population exposed Serology tests | 14,00% | |||||||||||||||
| %Losses Crude adjusted DR High | 0,38% | 0,38% | 0,38% | 0,38% | 0,38% | 0,38% | 0,38% | 0,30% | 0,28% | 0,28% | 0,25% | 0,22% | 0,22% | 0,22% | 0,22% | |
| %Losses Crude adjusted DR LOW | 0,08% | 0,08% | 0,08% | 0,08% | 0,08% | 0,08% | 0,08% | 0,08% | 0,08% | 0,08% | 0,07% | 0,07% | 0,07% | 0,07% | 0,07% | |
| % Losses as per serology test confirmed | 0,37% | |||||||||||||||
| % Accuracy of model | High | High | High | High | High | |||||||||||
| 16/03/20 | 23/03/20 | 30/03/20 | 06/04/20 | 13/04/20 | 20/04/20 | 27/04/20 | 04/05/20 | 11/05/20 | 18/05/20 | 25/05/20 | 01/06/20 | 08/06/20 | 15/06/20 | 22/06/20 | ||
| UK | % of population exposed high | 0% | 2% | 5% | 12% | 23% | 32% | 37% | 40% | 45% | 50% | 55% | 58% | |||
| % of population exposed (heat effect) | 0% | 1% | 3% | 9% | 12% | 20% | 27% | 29% | 31% | 33% | 35% | 35% | ||||
| % of population exposed Serology tests | ||||||||||||||||
| %Losses Crude adjusted DR High | 0,22% | 0,28% | 0,28% | 0,28% | 0,28% | 0,28% | 0,28% | 0,28% | 0,28% | 0,22% | 0,22% | 0,21% | 0,21% | 0,21% | 0,21% | |
| %Losses Crude adjusted DR LOW | 0,08% | 0,08% | 0,08% | 0,08% | 0,07% | 0,08% | 0,08% | 0,07% | 0,07% | 0,07% | 0,07% | 0,07% | 0,07% | 0,07% | 0,07% | |
| % Losses as per serology test confirmed | ||||||||||||||||
| % Accuracy of model | High | High | High | OK | ||||||||||||
| 16/03/20 | 23/03/20 | 30/03/20 | 06/04/20 | 13/04/20 | 20/04/20 | 27/04/20 | 04/05/20 | 11/05/20 | 18/05/20 | 25/05/20 | 01/06/20 | 08/06/20 | 15/06/20 | 22/06/20 | ||
| Sweden | % of population exposed high | |||||||||||||||
| % of population exposed low (heat effect) | ||||||||||||||||
| % of population exposed Serology tests | ||||||||||||||||
| %Losses Crude adjusted DR High | ||||||||||||||||
| %Losses Crude adjusted DR LOW | ||||||||||||||||
| % Losses as per serology test confirmed | ||||||||||||||||
| % Accuracy of model | ||||||||||||||||
| 16/03/20 | 23/03/20 | 30/03/20 | 06/04/20 | 13/04/20 | 20/04/20 | 27/04/20 | 04/05/20 | 11/05/20 | 18/05/20 | 25/05/20 | 01/06/20 | 08/06/20 | 15/06/20 | 22/06/20 | ||
| Portugal | % of population exposed high | 0% | 0% | 2% | 5% | 12% | 28% | 35% | 45% | 55% | 60% | 65% | ||||
| % of population exposed (heat effect) | 0% | 0% | 1% | 3% | 7% | 12% | 20% | 30% | 32% | 35% | 40% | |||||
| % of population exposed Serology tests | ||||||||||||||||
| %Losses Crude adjusted DR High | 0,22% | 0,28% | 0,28% | 0,28% | 0,28% | 0,28% | 0,28% | 0,28% | 0,28% | 0,22% | 0,22% | 0,21% | 0,21% | 0,21% | 0,21% | |
| %Losses Crude adjusted DR LOW | 0,08% | 0,08% | 0,08% | 0,08% | 0,07% | 0,08% | 0,08% | 0,07% | 0,07% | 0,07% | 0,07% | 0,07% | 0,07% | 0,07% | 0,07% | |
| % Losses as per serology test confirmed | ||||||||||||||||
| % Accuracy of model | High | High | High | OK |
Analysis on the effect of temperature
| 1= Hot all year >26 | 2= Mostly Hot all year >20 | 3= Tempered Cold >5 All year | 4= Colder |
| Country | Population | Heat | Sun | Humidity | Wealth | Death rate | Reporting capacity | Group | March | April | May | June | March | April | May | June | March | April | May | June | March | April | May | June |
|---|---|---|---|---|---|---|---|---|---|---|---|---|---|---|---|---|---|---|---|---|---|---|---|---|
| Malaysia | 31000000 | 1 | M | H | H | 5 | 100 | Asia | 35 | 33826 | 0.109114526953886 | 0.0001129 | ||||||||||||
| Singapore | 5612000 | 1 | H | H | H | 3.5 | 100 | Asia | 3 | 4142 | 0.073804318782721 | 0.0000535 | ||||||||||||
| Taiwan | 24000000 | 1 | M | H | H | 8 | 100 | Asia | 2 | 1208 | 0.00503355704698 | 0.0000083 | ||||||||||||
| Emirates | 9400000 | 1 | H | L | H | 2 | 100 | ME | 3 | 7248 | 0.077109810081394 | 0.0000319 | ||||||||||||
| Qatar | 2640000 | 1 | H | L | H | 2 | 100 | ME | 1 | 2416 | 0.091519219035998 | 0.0000379 | ||||||||||||
| Israel | 8755000 | 2 | H | L | MH | 5.2 | 100 | ME | 15 | 13939 | 0.159212804719303 | 0.0001713 | ||||||||||||
| South Korea | 51000000 | 3 | M | D | H | 6.3 | 100 | Asia | 152 | 116587 | 0.22860150771718 | 0.0002980 | ||||||||||||
| Japan | 127000000 | 3 | ML | M | H | 10.7 | 100 | Asia | 56 | 25290 | 0.019913461391246 | 0.0000441 | ||||||||||||
| France | 67000000 | 3 | ML | M | H | 9 | 90 | Europe | 3024 | 1623624 | 2.42331964339378 | 0.0045134 | ||||||||||||
| Italy | 60000000 | 3 | M | M | H | 10.8 | 90 | Europe | 12250 | 5480984 | 9.13497390007457 | 0.0204167 | ||||||||||||
| Spain | 47000000 | 3 | M | M | H | 9.2 | 90 | Europe | 8189 | 4301196 | 9.15148166313815 | 0.0174234 | ||||||||||||
| Denmark | 5603000 | 4 | L | M | H | 9.3 | 100 | Europe | 90 | 46763 | 0.834613041130155 | 0.0016063 | ||||||||||||
| Sweden | 10120000 | 4 | L | M | H | 9.4 | 100 | Europe | 146 | 75054 | 0.741635854537779 | 0.0014427 | ||||||||||||
| Germany | 83000000 | 4 | L | M | H | 11.3 | 100 | Europe | 651 | 278387 | 0.335405886776899 | 0.0007843 | ||||||||||||
| Netherlands | 17180000 | 4 | L | M | H | 8.7 | 100 | Europe | 864 | 479889 | 2.79329985217172 | 0.0050291 | ||||||||||||
| Average | 1.74526926979678 | 0.0034649 | ||||||||||||||||||||||
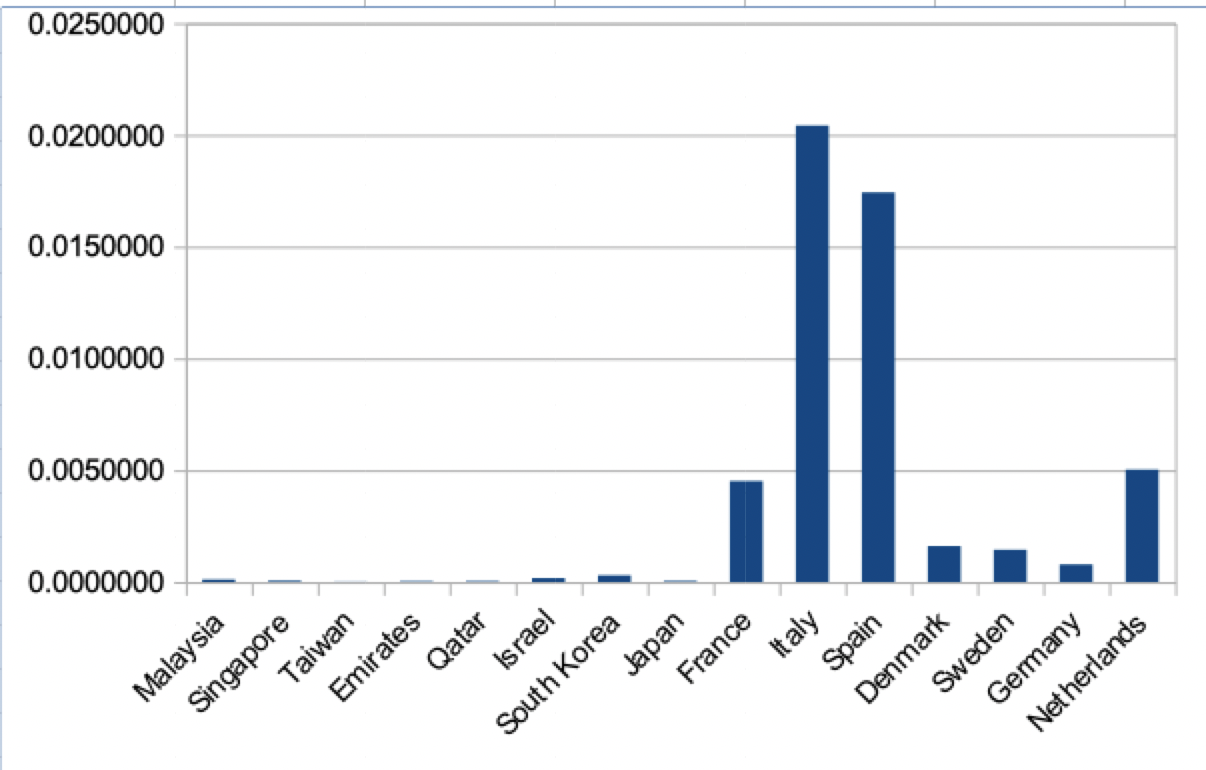
| Average 1 hot | 0.071316286380196 | 4.88974237507825E-05 | ||||||||||||||||||||||
| Average 2 | 0.159212804719303 | 0.00017133066819 | ||||||||||||||||||||||
| Average 3 | 4.19165803514298 | 0.0085391 | ||||||||||||||||||||||
| Average 4 Cold | 1.17623865865414 | 0.0022156 | ||||||||||||||||||||||
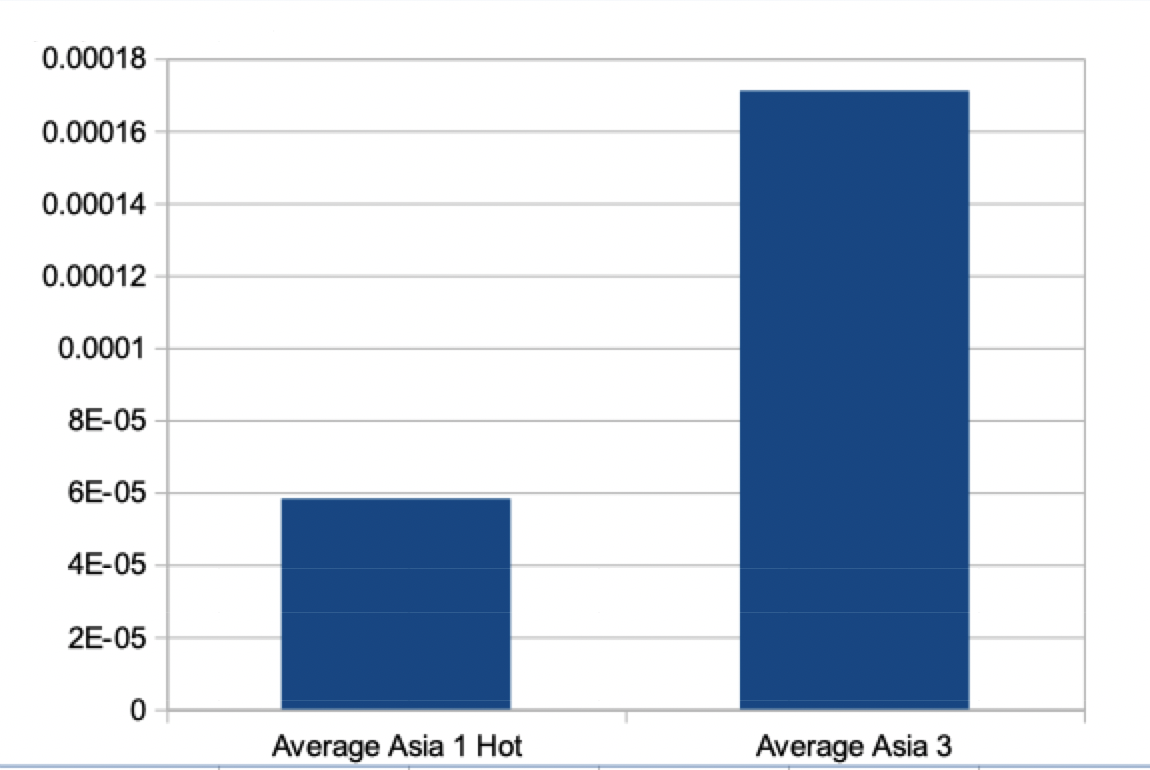
| Average Asia 1 Hot | 0.062650800927862 | 5.82311457527011E-05 | ||||||||||||||||||||||
| Average Asia 3 | 0.124257484554213 | 0.000171066851938 |
Since we don’t when it started we chose a group of countries that are hot all year with good reporting capabilities and that are destinations for international travel where the virus is very likely to have had cases under radar between novemebre and February
We are comparing these countries spread to that of Weather countries to try to guess how the spread of innocuoity may be altered as weather warms up
Air conditionning in malls, hospitals, supermarkets….may alter that effect
This preliminary data indicates that either the spread or innocuoity of the virus are impacted in a positive way by heat as off a threshold. Below that threshold it does not seem to be affected
 |
 |