Denmark Story Model
This Page shows how according to this model Denmark story would be described.
It is only an attempt to describe subject to corrections, improvements, suggestions.
Many models may provide different conclusions, this one shows some consistency and is the reason why we are sharing for better research for all.
You can see our analysis on the data and cross check to see how accurate the analysis is. You can see the dates, as per our analysis, at which the curve changes and things start becoming better by clicking here.
Most should recover in all cases and may develop some form of immunity
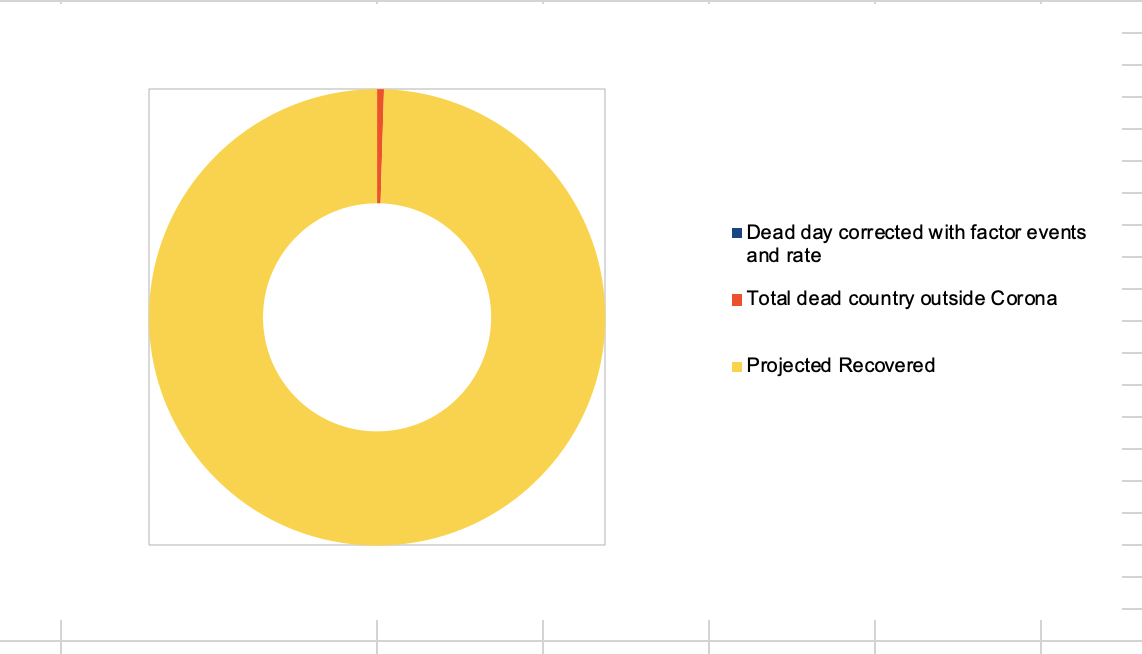
Life finds a way and most will recover and let’s remember all those who may have left us
Unfortunately sometimes life ends, we all try our best to have long nice best moments.
Some go with Corona (Maybe it shortenned their life, maybe not)
Some just go every day Let’s honor them all Let’s take care of a larger picture (obsessions restrict our thoughts)
A thought for healthcared professionals who have left because they were overworked
A thought for the elder who have left us with or without Corona without being able to say goodbye because of confinement
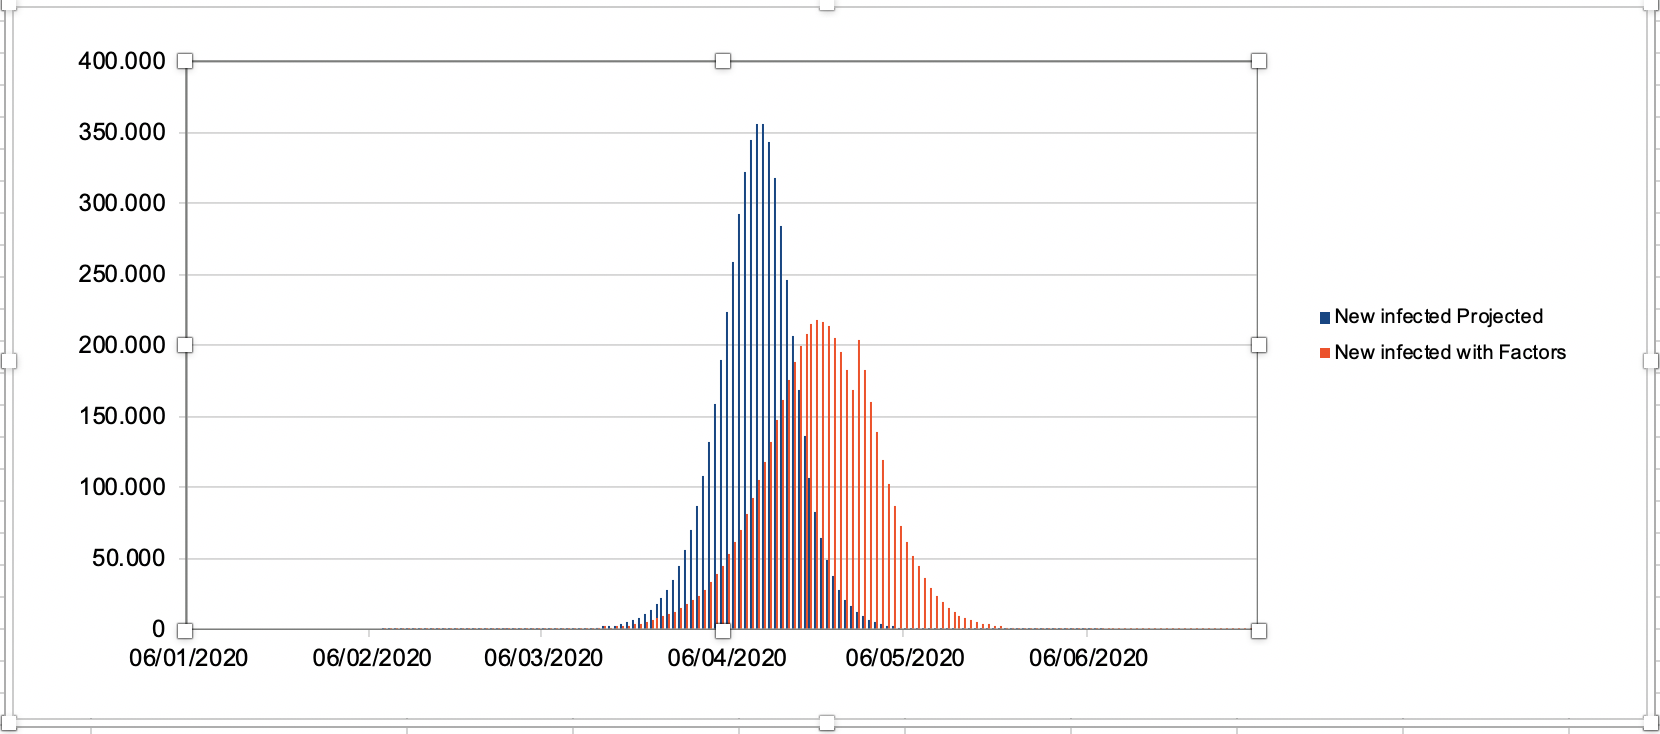
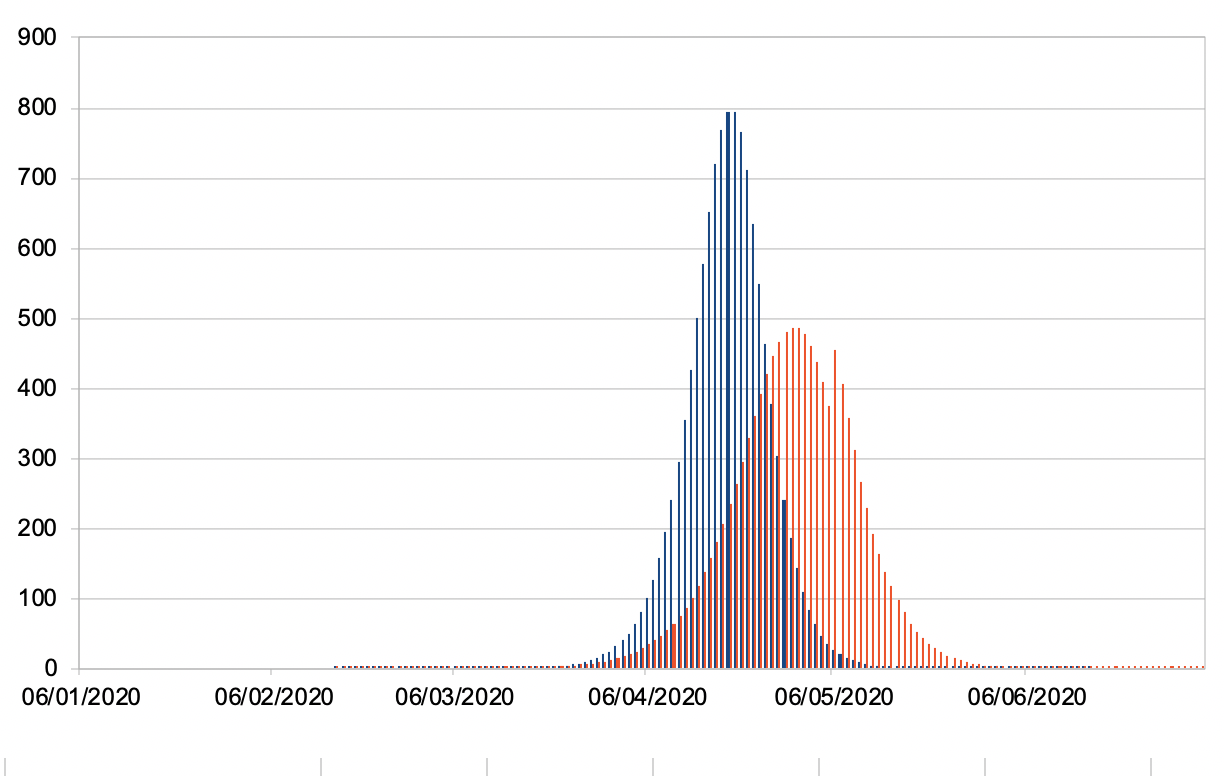
Infected in blue recovered in red
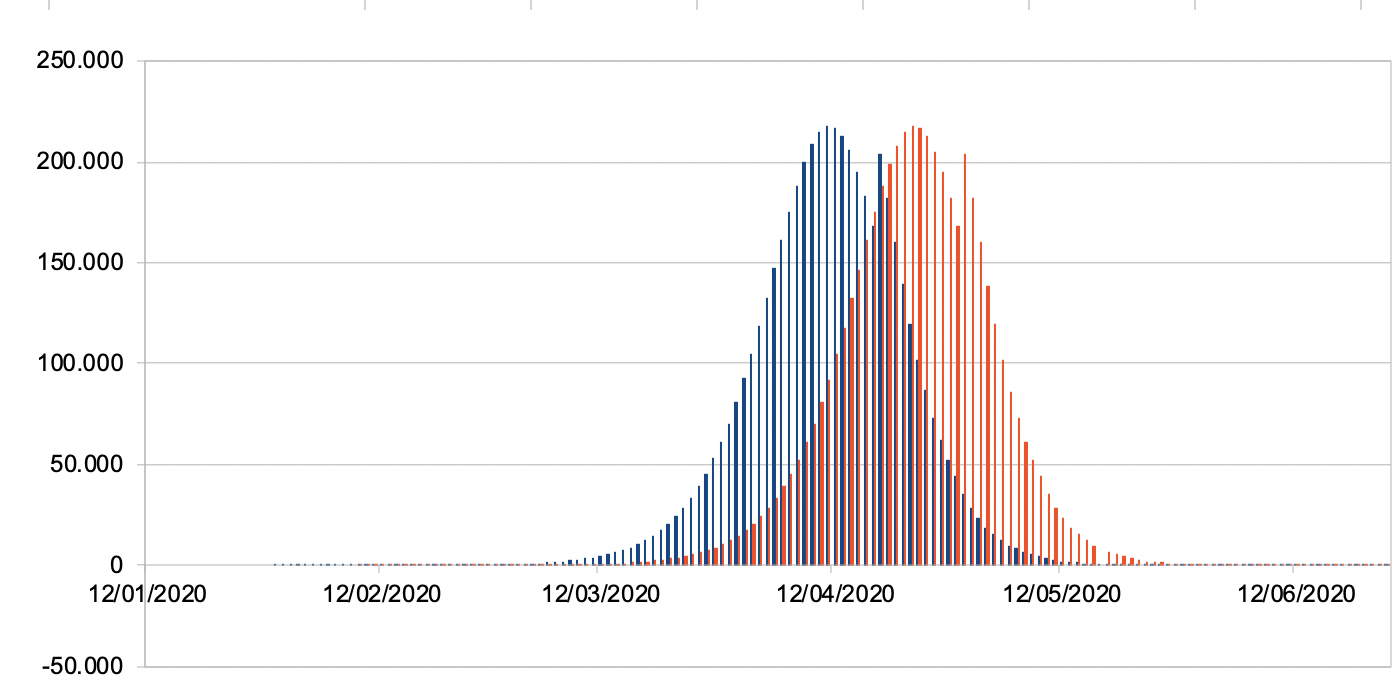
Infections and recoveries
All are stronger and a little more adapted
Much of the Population has immunity
Time to reconstruct
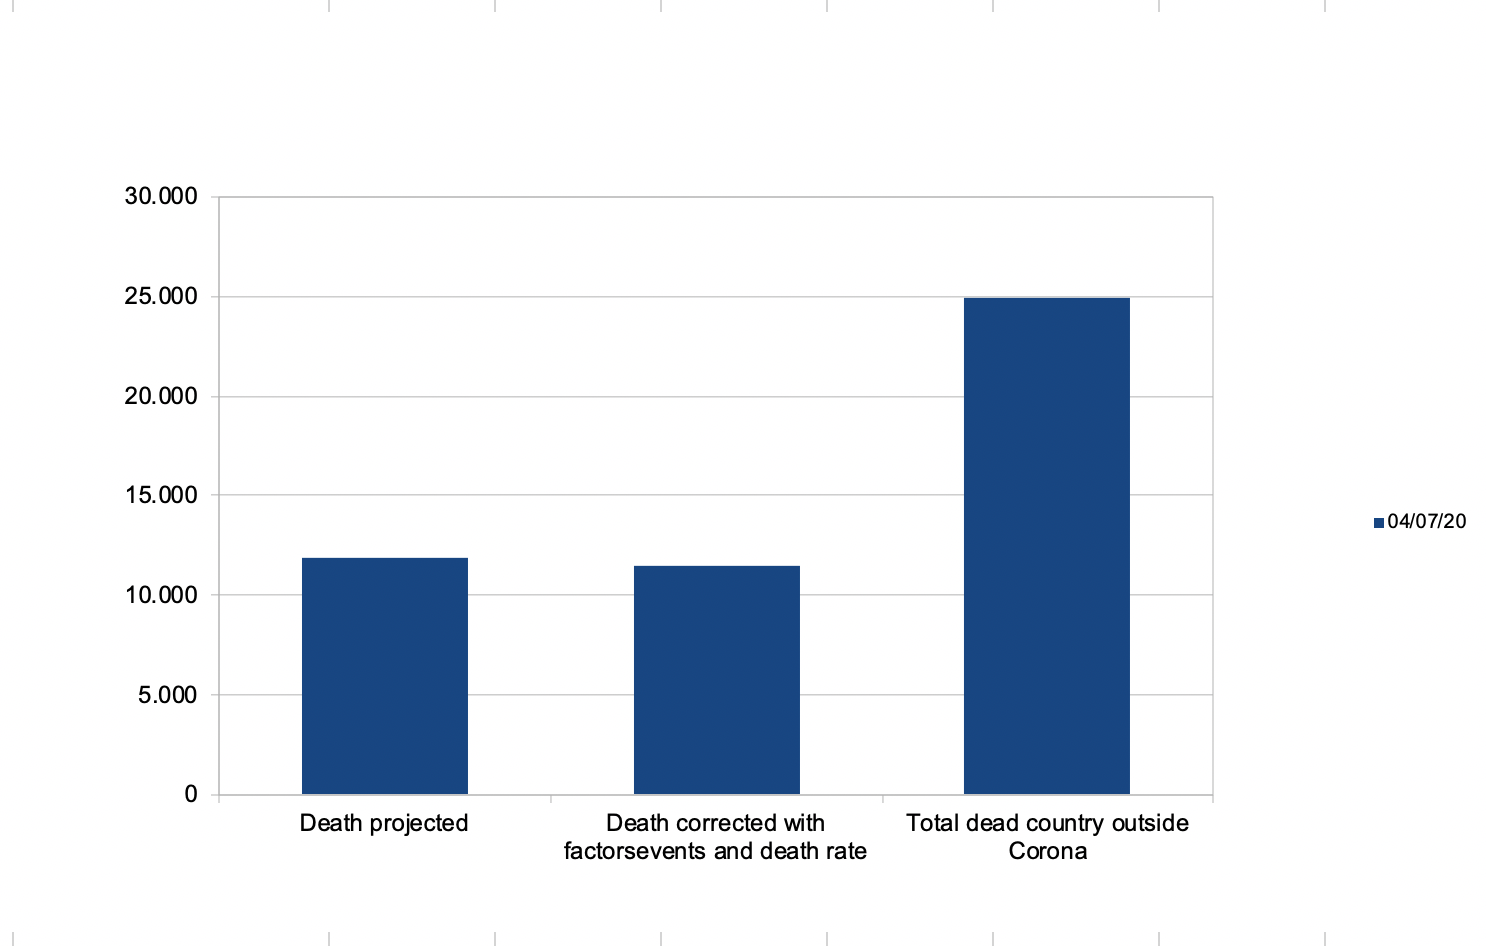
How does the model test against reality
Our analysis and its corelation to real available data is underneath:
| Date | Real Losses | Modeled Losses |
|---|---|---|
| 08/03/20 | 0 | 0 |
| 09/03/20 | 0 | 1 |
| 10/03/20 | 0 | 1 |
| 11/03/20 | 0 | 1 |
| 12/03/20 | 0 | 1 |
| 13/03/20 | 0 | 2 |
| 14/03/20 | 1 | 2 |
| 15/03/20 | 2 | 2 |
| 16/03/20 | 4 | 3 |
| 17/03/20 | 4 | 4 |
| 18/03/20 | 4 | 5 |
| 19/03/20 | 6 | 6 |
| 20/03/20 | 9 | 8 |
| 21/03/20 | 13 | 10 |
| 22/03/20 | 13 | 13 |
| 23/03/20 | 24 | 17 |
| 24/03/20 | 32 | 21 |
| 25/03/20 | 34 | 27 |
| 26/03/20 | 41 | 35 |
| 27/03/20 | 52 | 44 |
| 28/03/20 | 65 | 56 |