These findings are shared for research purposes and
indications for decision makers to help them broaden perspectives
and expand understanding until they materialize in a reviewed
paper.
Socio-economic Factors
For
social
variables, we have looked at two sets of data; demographic data
(Density per km2, Average daily ridership for cities with a metro,
the GINI index of income distribution and the GDP per Capita) and
mobility data (changes in frequenting of residential, workplaces,
parks, grocery/pharmacy, retail/recreation and transit stations).
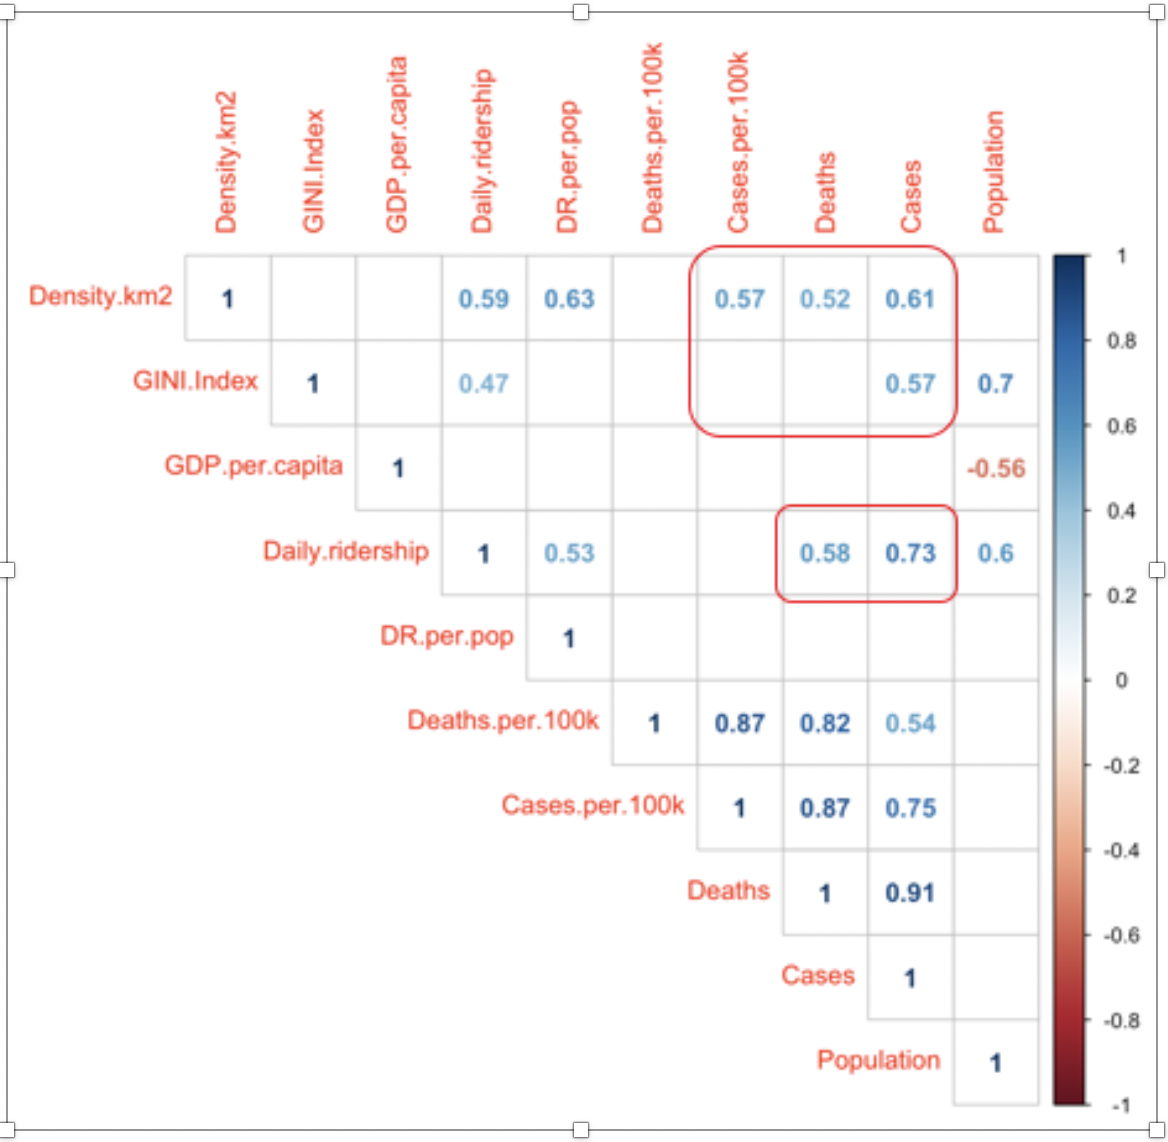
Demographic data
The
following correlations (and significance levels) have been found.
Positive
correlation with case count:
•
Average
daily ridership: 0.73, sig at 0.01
•
Density
km2: 0.61, sig at 0.05
•
GINI
Index: 0.57, sig at 0.10
Positive correlation with death count, sig at 0.10:
•
Average
daily ridership: 0.58
•
Density
km2: 0.52
Positive
correlation with cases per 100k, sig at 0.10:
•
Density
km2: 0.57
This
shows
that increases in ridership and higher population densities are
associated with both higher infection rates and deaths and that
higher income inequality (as measured by Gini) is associated with
a higher number of cases.
In
developing
countries, the epidemic seems to hit harder wealthier populations
first, whereas in Europe and United States it seems to hit more
unfavoured populations. Detailed data is not available for further
analysis.
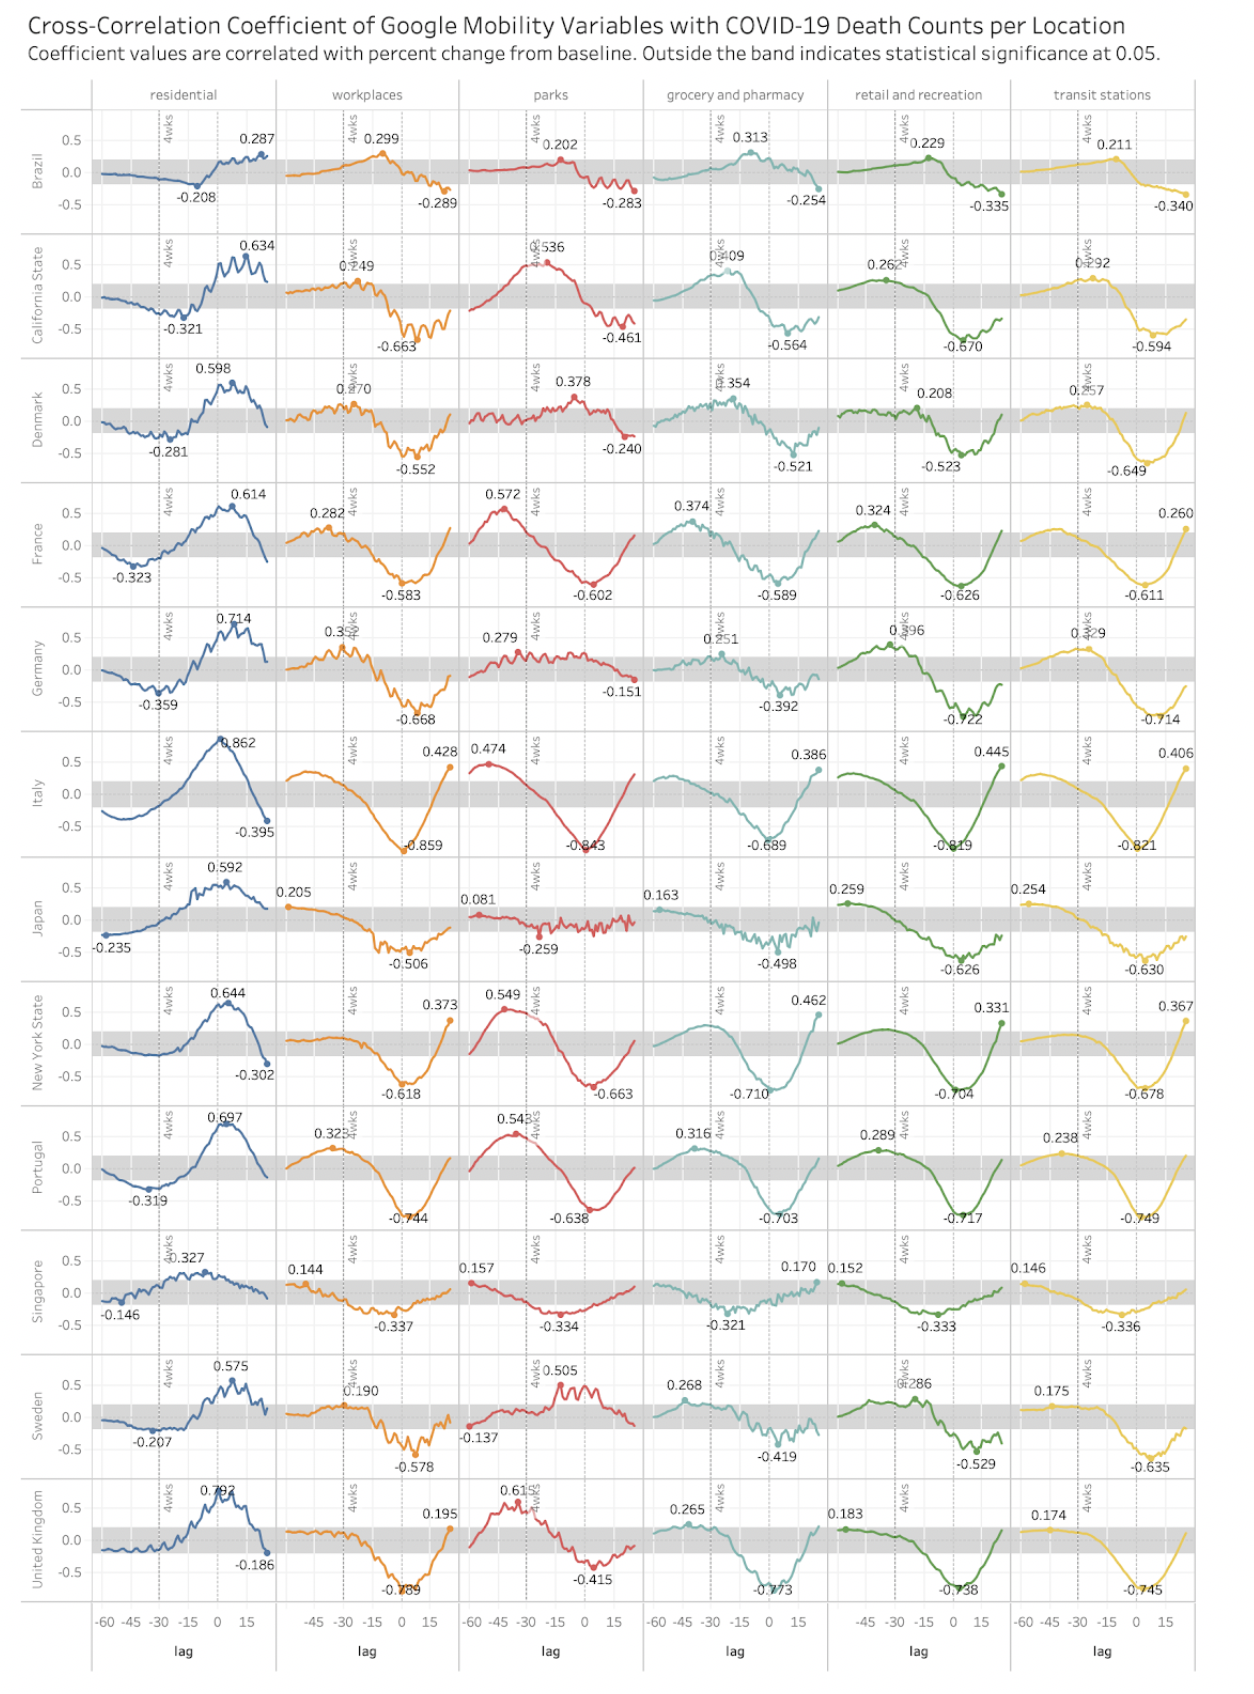
Mobility data
Using
Google mobility data, we have found that there is a statistically
significant systematic
correlation in most countries at +25 lag between the transit
stations presence and deaths in locations where there's a high
death count of COVID-19.
This
pattern also applies on workplaces including in countries whith
mild or no lockdow.
Metro/Subway
ridership is often an indication of office concentrations in
modern buildings with shut windows possibly recycled air or A/C
where clusters may form. So actually both variables may correlate.
So
it is hard to account that metro mass transportation could have
contributed to the high infection rate or is it office buildings
or a combination (as there’s high correlation between daily death
count and cases count).
Significance
was set at 0.05df = 25 that correlation coefficient should be >
|0.22|
To
a lesser extent a similar pattern applies to retail and
recreation. This is altered in the sense that most recreation and
retail had been closed in almost all countries and restricted in
Sweden.
All
five hardest hit cities were dense and had a dense subway (London,
New York, Madrid, Brussels, Milan, Paris)