Spain Story Model
This Page shows how according to this model the Spain story would be described.
It is only an attempt to describe subject to corrections, improvements, suggestions.Many models may provide different conclusions, this one shows some consistency and is the reason why we are sharing for better research for all.
You can see our analysis on the data and cross check to see how accurate the analysis is. You can see the dates, as per our analysis, at which the curve changes and things start becoming better by clicking here.
| This country has a population of 47 Millions | |||||||||||||||||||||||||||||||||||||
| This model describes best if situation started January 12th 2020 | |||||||||||||||||||||||||||||||||||||
| Each individual was infecting at a rate of 0.3 per day during 9 to 10 days | |||||||||||||||||||||||||||||||||||||
| Government proceeded to progressive lockdowns March 14th | |||||||||||||||||||||||||||||||||||||
| https://www.theguardian.com/world/2020/feb/28/coronavirus-may-have-been-in-italy-for-weeks-before-it-was-detected |
(2,7 to 3,0) Fits best ran models – except for South Korea that seems to capture clusters regulary |
||||||||||||||||||||||||||||||||||||
| (2,7 to 3,0) Fits best ran models – except for South Korea that seems to capture clusters regulary | Model may work if its started a few days later but entered 2 infected people navigating in different spheres or a superspreader appeared early on | ||||||||||||||||||||||||||||||||||||
| On March 14th 5%? (Infected people) | |||||||||||||||||||||||||||||||||||||
| Spain has a steeper curve that maybe explained by the possibility that a group of infected got in early Feb or by some super-spreading very early | |||||||||||||||||||||||||||||||||||||
|
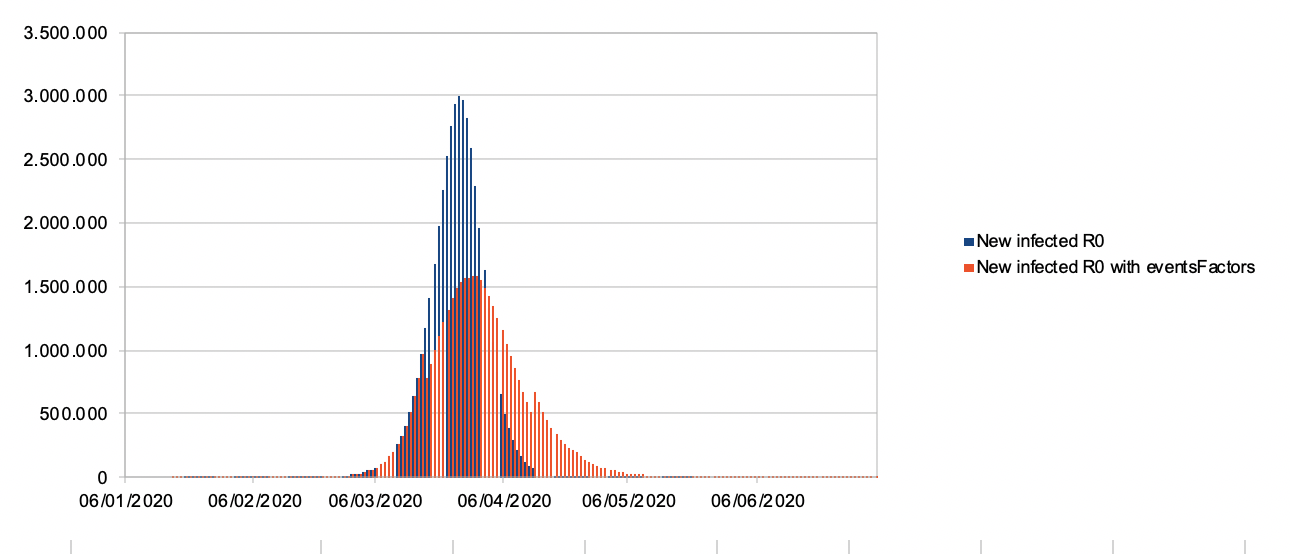
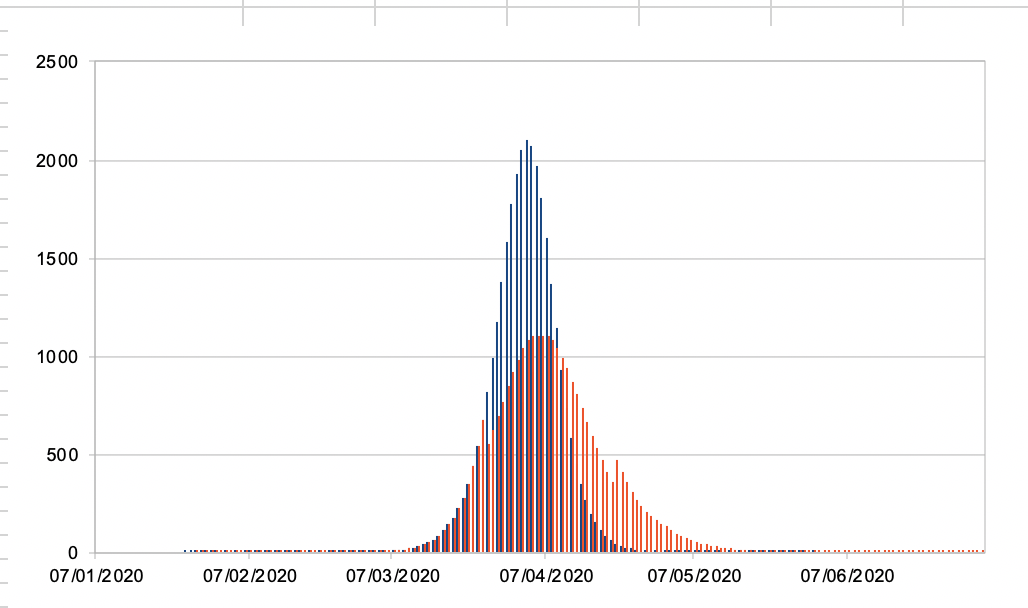
Projected daily loss in blue natural spread in red with confinment
What will be the effect of heat in the coming weeks
Spain will tell us a lot as we move onto April
There are reasons to hope spring and heat may slow it down as 4 out 5
Coronaviruses see their spread slowed down by heat
Most should recover in all cases and may develop some form of immunity
Life finds a way and most will recover and let’s remember all those who may have left us

Unfortunately sometimes life ends, we all try our best to have long nice best moments.
Some go with Corona (Maybe it shortenned their life, maybe not)
Some just go every day Let’s honor them all
Let’s take care of a larger picture (obsessions restrict our thoughts)
A thought for healthcared professionals who have left because they were overworked
Infected in blue recovered in red
Infections and recoveries
All are stronger and a little more adapted
Much of the Population has immunity
Time to reconstruct
How does the model test against reality
Hypothesis confinement peak minimized if until April 12th. At this stage 2/3 of population would have been infected
Our analysis and its corelation to real available data is underneath:
| Date | Real Losses | Modeled Losses |
| 15/03/20 | 292 | 332 |
| 16/03/20 | 342 | 422 |
| 17/03/20 | 510 | 535 |
| 18/03/20 | 624 | 679 |
| 19/03/20 | 803 | 861 |
| 20/03/20 | 1,050 | 1089 |
| 21/03/20 | 1,378 | 1376 |
| 22/03/20 | 1,756 | 1736 |
| 23/03/20 | 2,207 | 2183 |
| 24/03/20 | 2800 | 2738 |
| 25/03/20 | 3445 | 3420 |
| 26/03/20 | 4145 | 3976 |
| 27/03/20 | 5,138 | 4606 |
| 28/03/20 | 5,812 | 5310 |