Introduction


These findings are shared for research purposes and indications for decision makers to help them broaden perspectives and expand understanding until they materialize in a reviewed paper.

We proceeded to a worldwide multiple factors analysis identifying factors across countries and their effects as to severity or propagation of the epidemic. We decided to publish our findings on this site until producing a paper to share and help researchers, decision makers and individuals who wish to. We can be contacted for questions and further exploration if needs be. To view factors click here


We are grateful to  Professor Bricaire for his help, to view how  Professor Bricaire's input has helped us please click here

Our findings to help understand what happened and better plan the future.

We studied and cross referenced data on different countries, regions and seasons to draw conclusions.

Please click here to see our analysis on the correlation with metro ridership and UVs.

Disclaimer
We are sharing our findings here for in good faith and the best of our knowledge, please do not hesitate to contact us to help us improve the understanding of the picture.

Our initial model was expecting an epidemic end some time around end of the month of May, to view that table click here

1)We find correlations with subway/metro daily ridership, number of hours of day light and UVs

2)We find significant indications that the epidemic spread is cluster based, has a low K value and requires special circumstances thus having a varying R depending on different factors amongst which above mentioned.

3) We find significant indications that epidemic spread is favoured by promiscuity, prolonged exposure, in closed spaces, often air conditioned (recycled air) thus hinting towards aerosol contagion or shared toilets (faecal matter transmitted by hands in common spaces) or both. But also hinting towards higher fragility and higher sensitivity in such closed spaces with artificial air recycling and cooling/heating.

4) We also find significant indications that the epidemic will only affect a subset of the population ranging from 28% to 72%.

5) We find significant indications that some countries/regions have more favourable conditions to the spread of the epidemic.

6) We find signifcant indications that many countries/regions the epidemic may have started significantly before thought and in many places may have peaked earlier than thought thus indicating that the epidemic almost followed its natural spread until peak.

7) Based on above findings we feel herd immunity varies from region to region. It could be as low as 5% in some regions and up to 25% of the population in other regions. Regions where the epidemic peaked at its natural course are probably very close to have reached herd immunity for that epidemic.

8) Two main scenarios appear
 1) A progressive definitive fade away of the epidemic with clusters of infected people occasionally (likelyhood 45% dependent on animal reservoir and tropical area)
2) Virus picks up in a much more limited manner where herd immunity is incomplete when conditions and factors become favourable and that scenarios is also 45% likely and dependent on tropical regions and animal reservoirs. In that case based on immunity, it may be that from season to season or situation to situation it may become milder to reach the level of a common cold because of our adaptation to it.

We are preparing a synthetic paper with all our findings, scenarios that we will publish soon.


We will produce a new set of models taking in account these factors as well as  professor Bricaire's contributions

The conclusion would be the return of sanatoriums. (After all, we used these techniques in the middle ages)

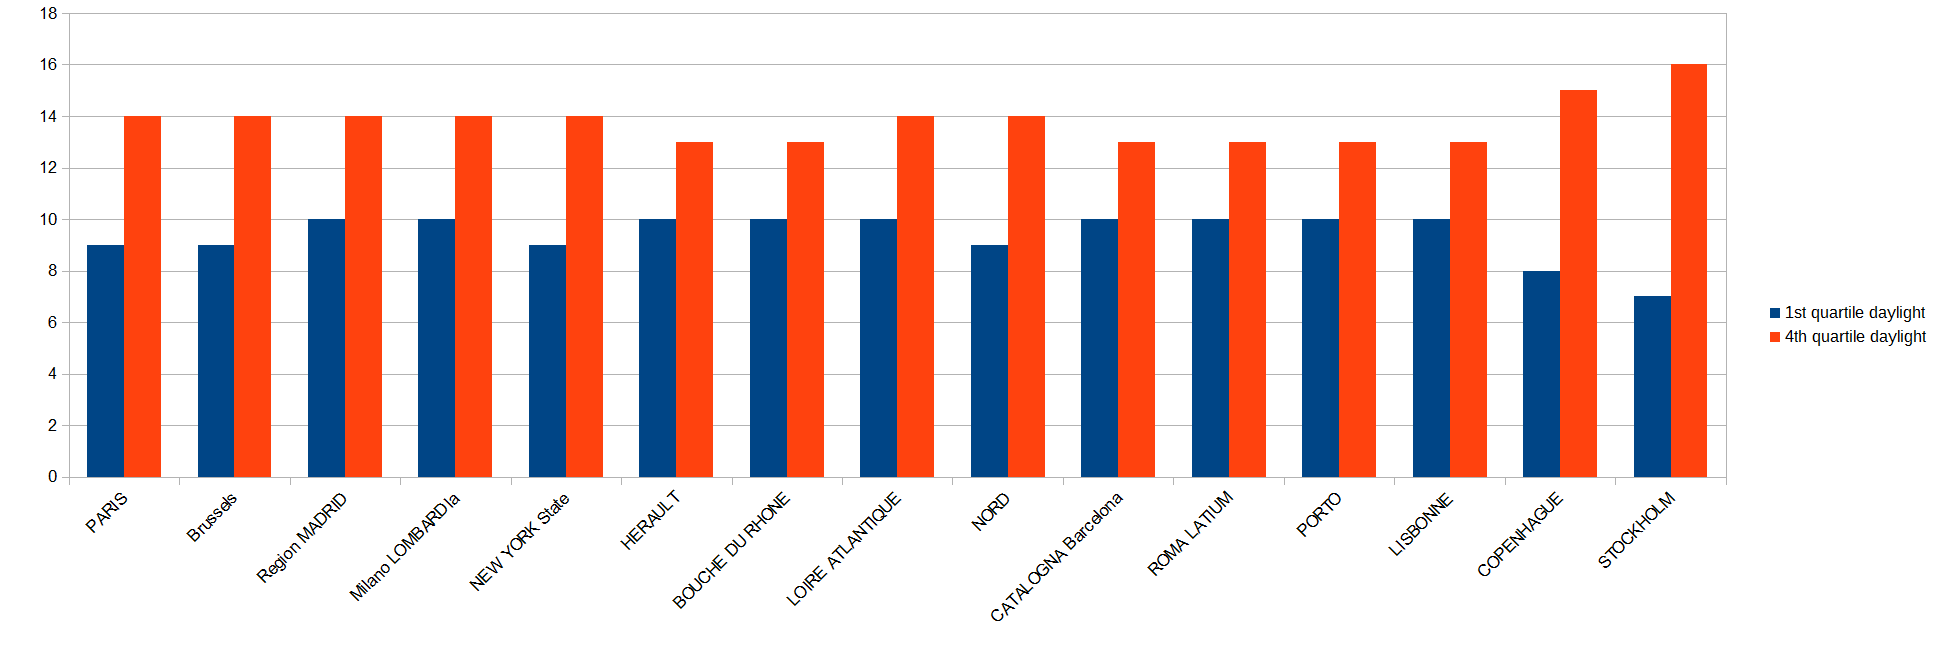
  • In cities studied below, first quartile, curve rising up happens as days are short, 4th quartile the curve dropping as days become longer
  • It doesn't like light (bats are nocturnal, Moscow should start dropping within 3 to 4 weeks)
  • It slows as days become longer (question: it struck hardest end of winter when vitamin D levels were lowest ?) 
  • It doesn't like the cold (it starts late in Scandinavia, New York, Moscow)
  • It doesn't like sea shore (Madrid vs Barcelona, Milan vs Rome, Paris vs Marseille, Brussels vs Lille)
  • It doesn't like heat (it has flat curves)
  • It seems to be more virulent in late winter early spring (sun deficit?)
  • It likes people grouped together with recycled ventilation (cave bat)


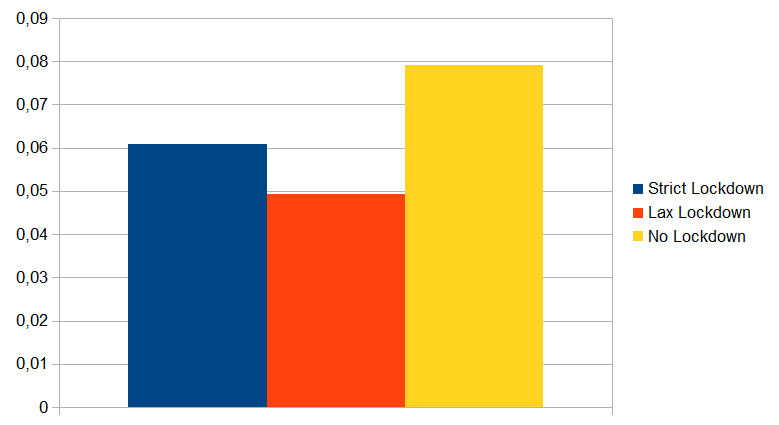
% of losses in the population to assess the severity of the epidemic by urban area


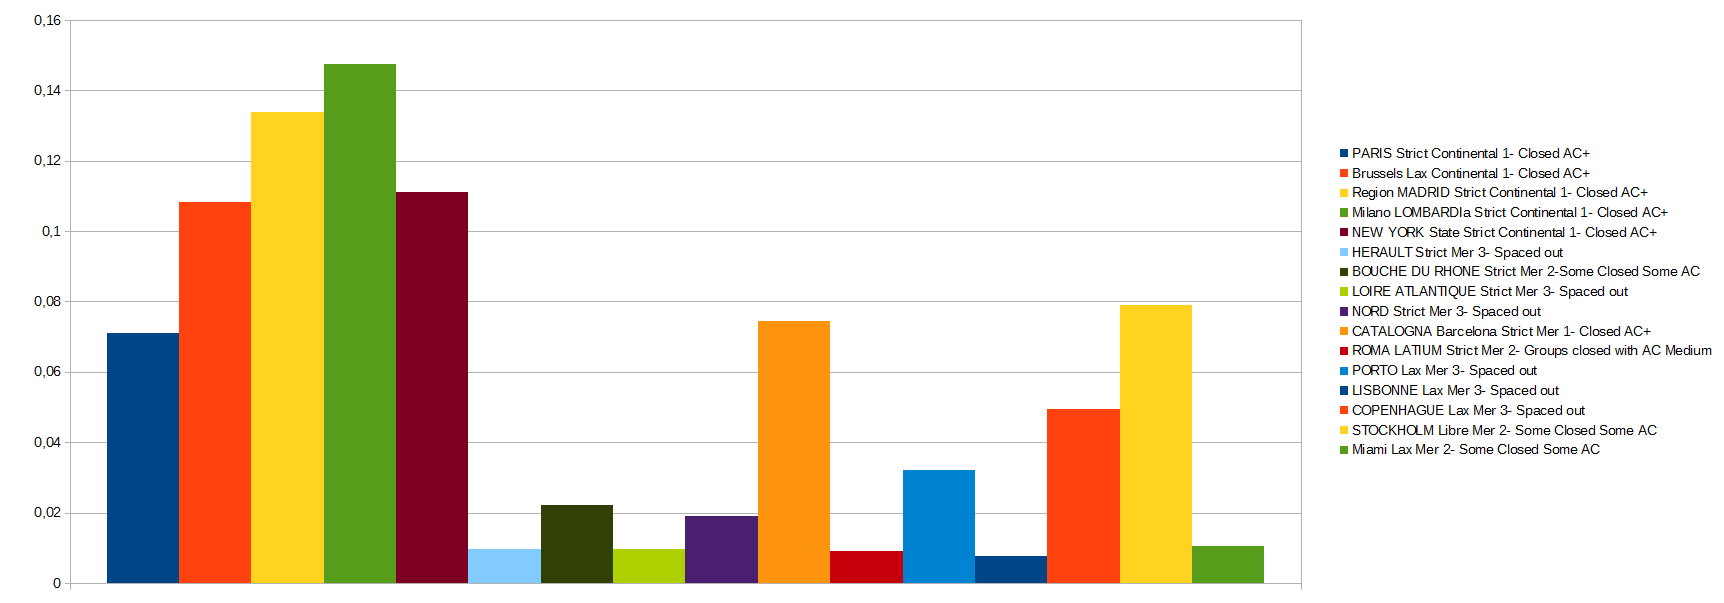
% of losses of population according to confinement (Italy, France, Spain), distance (Australia, Denmark), Free Sweden


Starting temperature of the epidemic 2nd district Miami, Dallas and Sao Paolo have a higher temperature and a flat curve
Bell curve temperature for second quartile. Miami, Dallas and Sao Paola have higher temperatures, epidemic happens with a much flatter curve

1st quartile as epidemic rises days are short in explored cities and 4th quartile days are longer


You may want to download the spreadsheet to understand the model.

Please click here to visit our latest work in progress and latest scenarios.

Our initial model was expecting an epidemic end some time around end of the month of May 2020, to view that analysis please click here.

Why do we publish this

This is a work in progress we are sharing for suggestions to correct, improve, challenge by other computer scientists, mathematicians, or other people with a skill that can improve/correct the model

We feel humility is an asset

We feel thinking and thinking together is beneficial to all

Feel free to download the spreadsheet, play with it change it and redistribute it. We are giving this spreadsheet under copyleft MIT License provided you quote this website in any new derived spreadsheet you contribute

Feel free to send us new country region with your findings for above variables if you want us to try to include your region/country depending on availability of our resources

Contact US

Download Worksheet

The password to the worksheet is "Password1"


140x140

Wuhan Story

Please explore to see the Wuhan story

140x140

Italy Story

Please explore to see the Italy story

140x140

Spain Story

Please explore to see the France story

140x140

France Story

Please explore to see the France story

140x140

The Netherlands Story

Please explore to see the Netherlands story

140x140

Germany

Please explore to see the German story

140x140

The UK Story

Please explore to see the UK story

Copyright © MyWebsite. All rights reserved.