Analysis on effect of metro/subway daily ridership and the effect of UV
1. Introduction
The data needed to accurately track the transmission and impact of COVID-19 have been extremely hard to collect so far. The data that are actually available do not provide the full picture of the epidemic, are not standardized between the different countries, and sometimes are not even standardized within the same country. Understandably, most governments (and modelers) have focused their efforts on in-country tracking and predictions, making international comparisons very difficult. Be that as it may, these incomplete, non-standardized data and reports show a very different Covid19 transmission and impact picture by country, continent and hemisphere. By analyzing the Covid19 progression in a variety of countries, and using mortality as the primary predicted outcome variable, we have been able to build a simulation model that incorporates several key predictive variables and that can be tuned to explain the epidemic progression so far and predict the future trends for any area where base data is available.
UV and Ozone index levels
We have found that for a variety of European and Southern hemisphere cities (as well as New Delhi), there is strong correlation between daily UV levels (as published by dutch site ref) and deaths as well as new cases. The association is particularly strong when the mortality and new cases are lagged by 10-15 days (where the correlation coefficients range between |0.2| and |0.6|) as shown in the charts below. For Ozone, the correlation was weak. In this analysis |0.35| and above is significant at 0.05 level at 30 d.f..
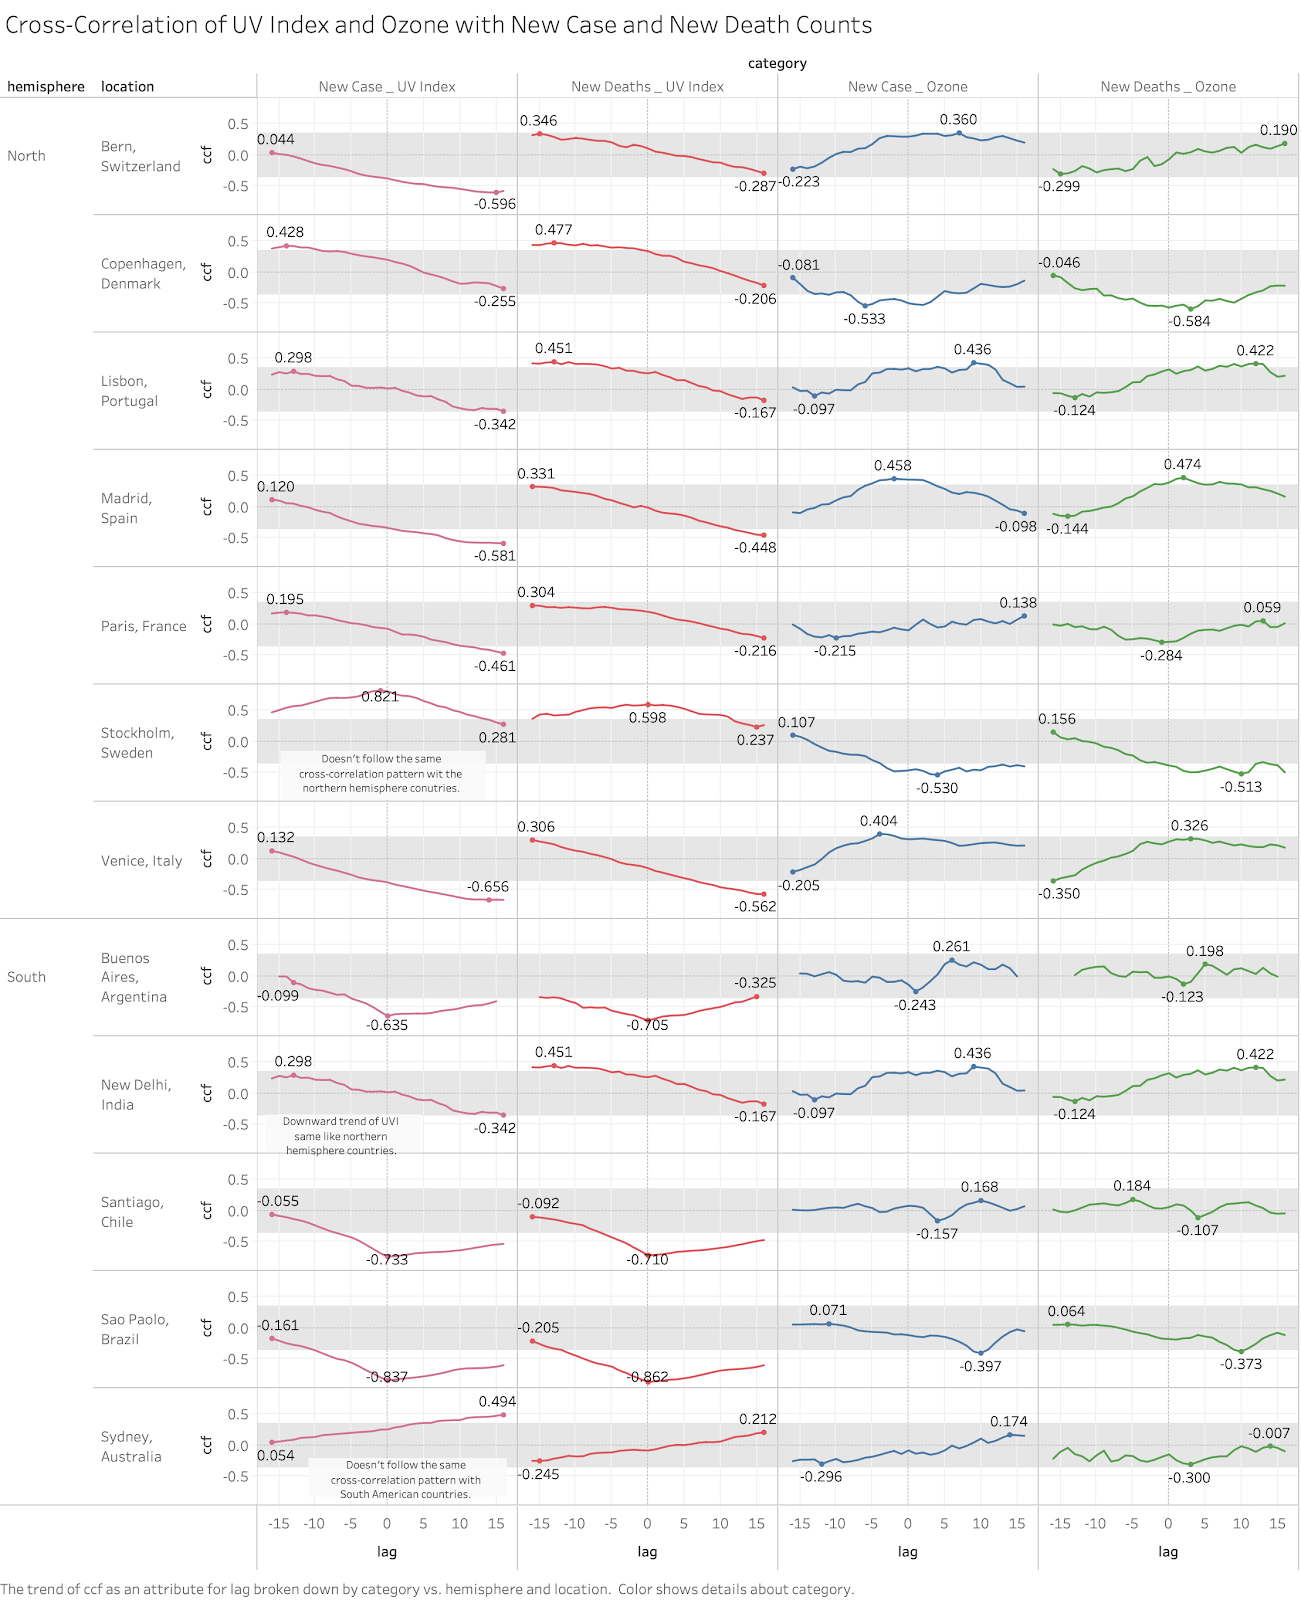
Figure 1 – Cross-correlation of UV Index and Ozone with new Case and new Death Counts per City
2.3.2 Demographic/ Social Variables
Ceteris paribus, higher population densities and social habits which include close contact/ touching will increase the virus transmission / R0; this is one of the key drivers of social distancing implementations. In addition, many illnesses correlate with income per capita and income distribution. For demographics, we have looked at the following variables; population Density per km2, Average daily ridership for cities with a metro, the GINI index of income distribution and the GDP per Capita. The following correlations (and significance levels) have been found.
Positive correlation with case count:
• Average daily ridership: 0.73, sig at 0.01
• Density km2: 0.61, sig at 0.05
• GINI Index: 0.57, sig at 0.10
Positive correlation with death count, sig at 0.10:
• Average daily ridership: 0.58
• Density km2: 0.52
Positive correlation with cases per 100k, sig at 0.10:
• Density km2: 0.57
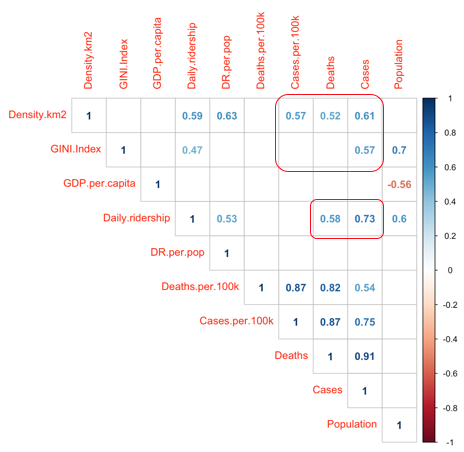
Figure 2 – Correlation matrix of economic and demographic related variables